
Y Combinator’s own startup directory lists 133 companies from its 2021 class as Inactive, more than any other year in YC’s history. The class is also the largest the directory shows for any year before 2026, with 725 companies across the Winter 2021 and Summer 2021 batches, so by share the figure is 18%, and older classes have closed at higher rates.
The directory labels every company Active, Acquired, Public or Inactive. The counts here come from a copy of that listing, the open-source yc-oss mirror, read on 16 November 2026. It holds 6,399 companies, the same total the directory’s batch filter shows. Inactive is YC’s own label, and every figure below uses it as is.
A YC batch is a funded cohort of startups that go through the program together and finish with a Demo Day, an event where they pitch investors. In 2021 YC ran two batches, Winter and Summer, and this article treats both together as the 2021 class. The directory’s recent years look different: it lists four batches a year for 2025 and 2026, and 852 companies for 2026, which is why class size matters when years are compared.
Where the 2021 class stands
Of the 725 companies, 508 are Active, 84 are Acquired and 133 are Inactive. None is listed as Public. That’s 70% Active, 12% Acquired and 18% Inactive. Winter 2021 has 335 companies and 66 of them are Inactive (20%). Summer 2021 has 390 and 67 are Inactive (17%). MentionFox, which tallies the same directory by batch, shows the same 20% and 17%.
YC’s 2021 year in review, written by then-president Geoff Ralston, says the batch program funded 750 companies that year, the most ever, with 350 in Winter and 402 in Summer. Every program ran remotely. The review, citing Crunchbase, put 2021 seed funding at US$29.4 billion, up 56% on the year before. The directory lists 725 companies for the two batches, and the shares in this article use that number.
The biggest count, not the biggest rate
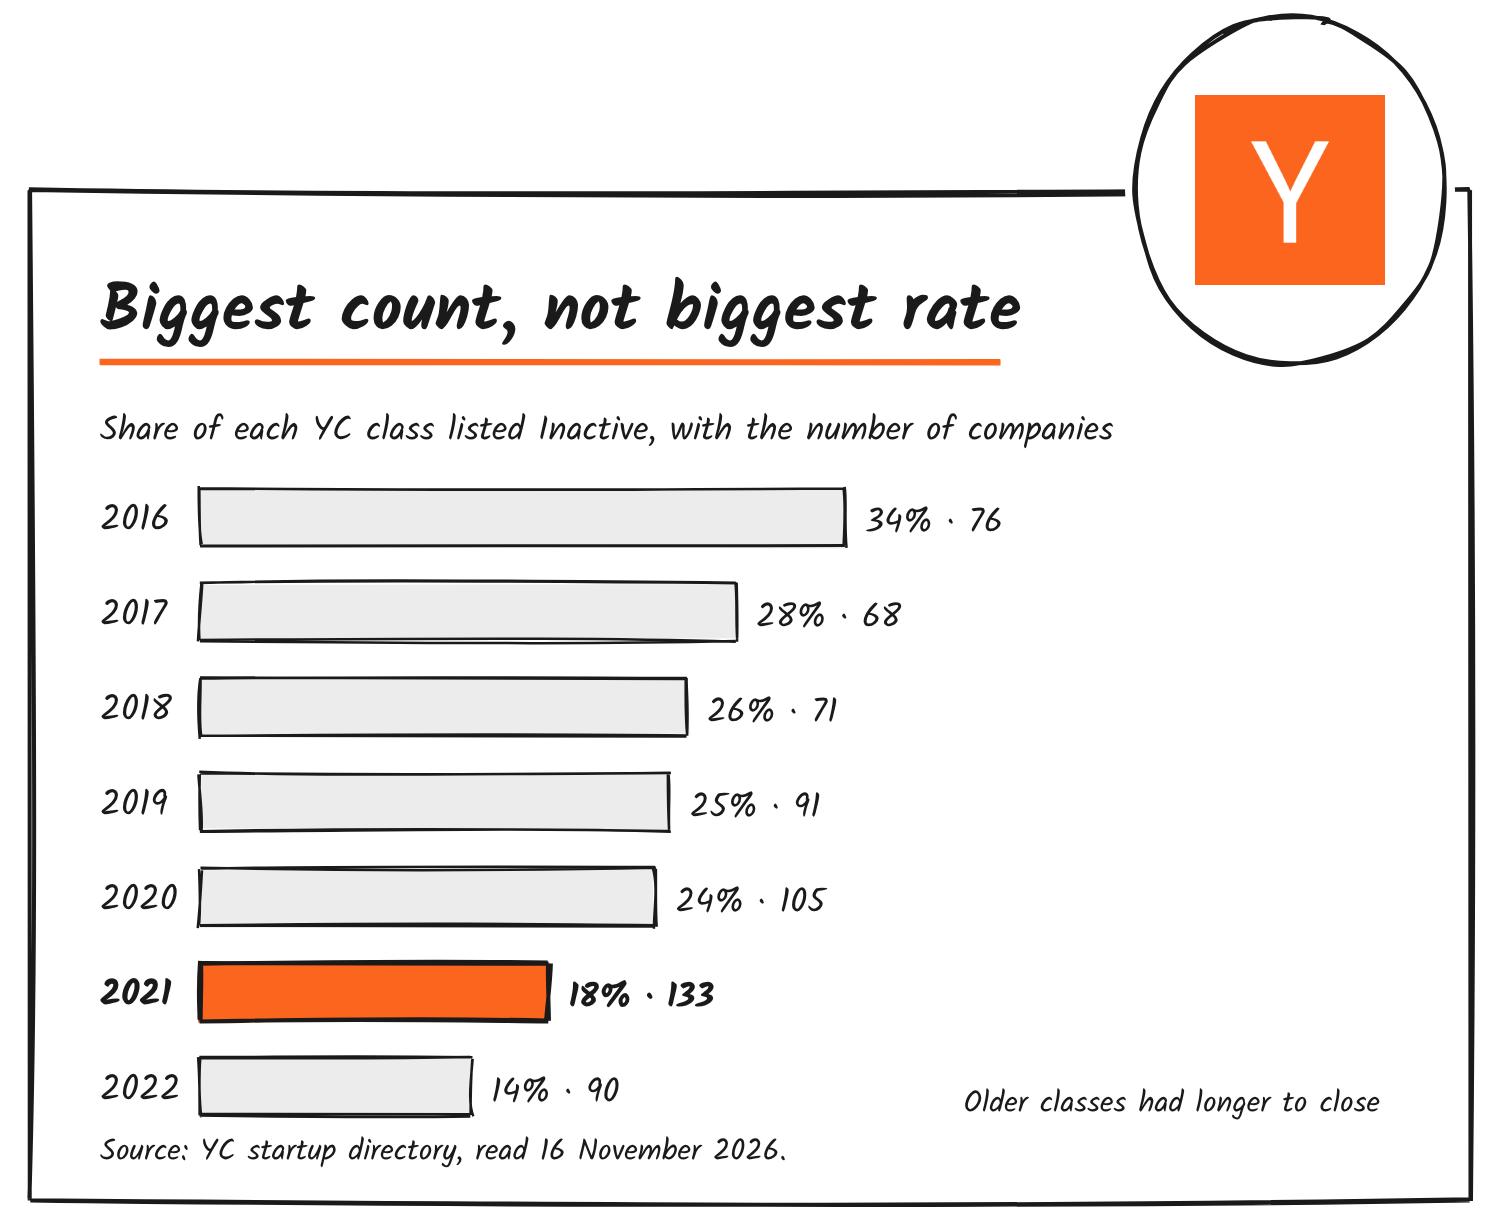
133 is the highest Inactive count for any class year. 2020 has 105, 2019 has 91 and 2022 has 90. The count follows the size of the class: 2020 had 438 companies and 2021 had 725. As a share of each year’s companies, 2021’s 18% sits below 2016’s 34%, 2017’s 28%, 2018’s 26%, 2019’s 25% and 2020’s 24%, and above 2022’s 14%. Older classes have had more years to close, so the years aren’t a like-for-like comparison.
A count and a rate answer different questions. A count says how many companies closed, and so how many founders, employees and investors were affected: 133 for 2021. A rate says how likely a company in that class was to be listed Inactive: 18% for 2021. The headline figure is the count, and the rate is the one to use when comparing years.
| Class | Companies | Inactive | Share Inactive | Acquired | Share Acquired |
|---|---|---|---|---|---|
| 2016 | 224 | 76 | 34% | 46 | 21% |
| 2017 | 241 | 68 | 28% | 64 | 27% |
| 2018 | 277 | 71 | 26% | 50 | 18% |
| 2019 | 368 | 91 | 25% | 60 | 16% |
| 2020 | 438 | 105 | 24% | 77 | 18% |
| 2021 | 725 | 133 | 18% | 84 | 12% |
| 2022 | 631 | 90 | 14% | 54 | 9% |
Set against acquisitions, 2021 has 133 Inactive companies for 84 Acquired, or 1.6 for every acquisition. Across every class in the directory the figures are 1,109 Inactive and 843 Acquired, about 1.3. 2020’s ratio is 1.4 (105 against 77) and 2022’s is 1.7 (90 against 54). Acquisitions are where 2021 trails most: 84 is 12% of the class, against 18% for 2020.
Consumer took the hit
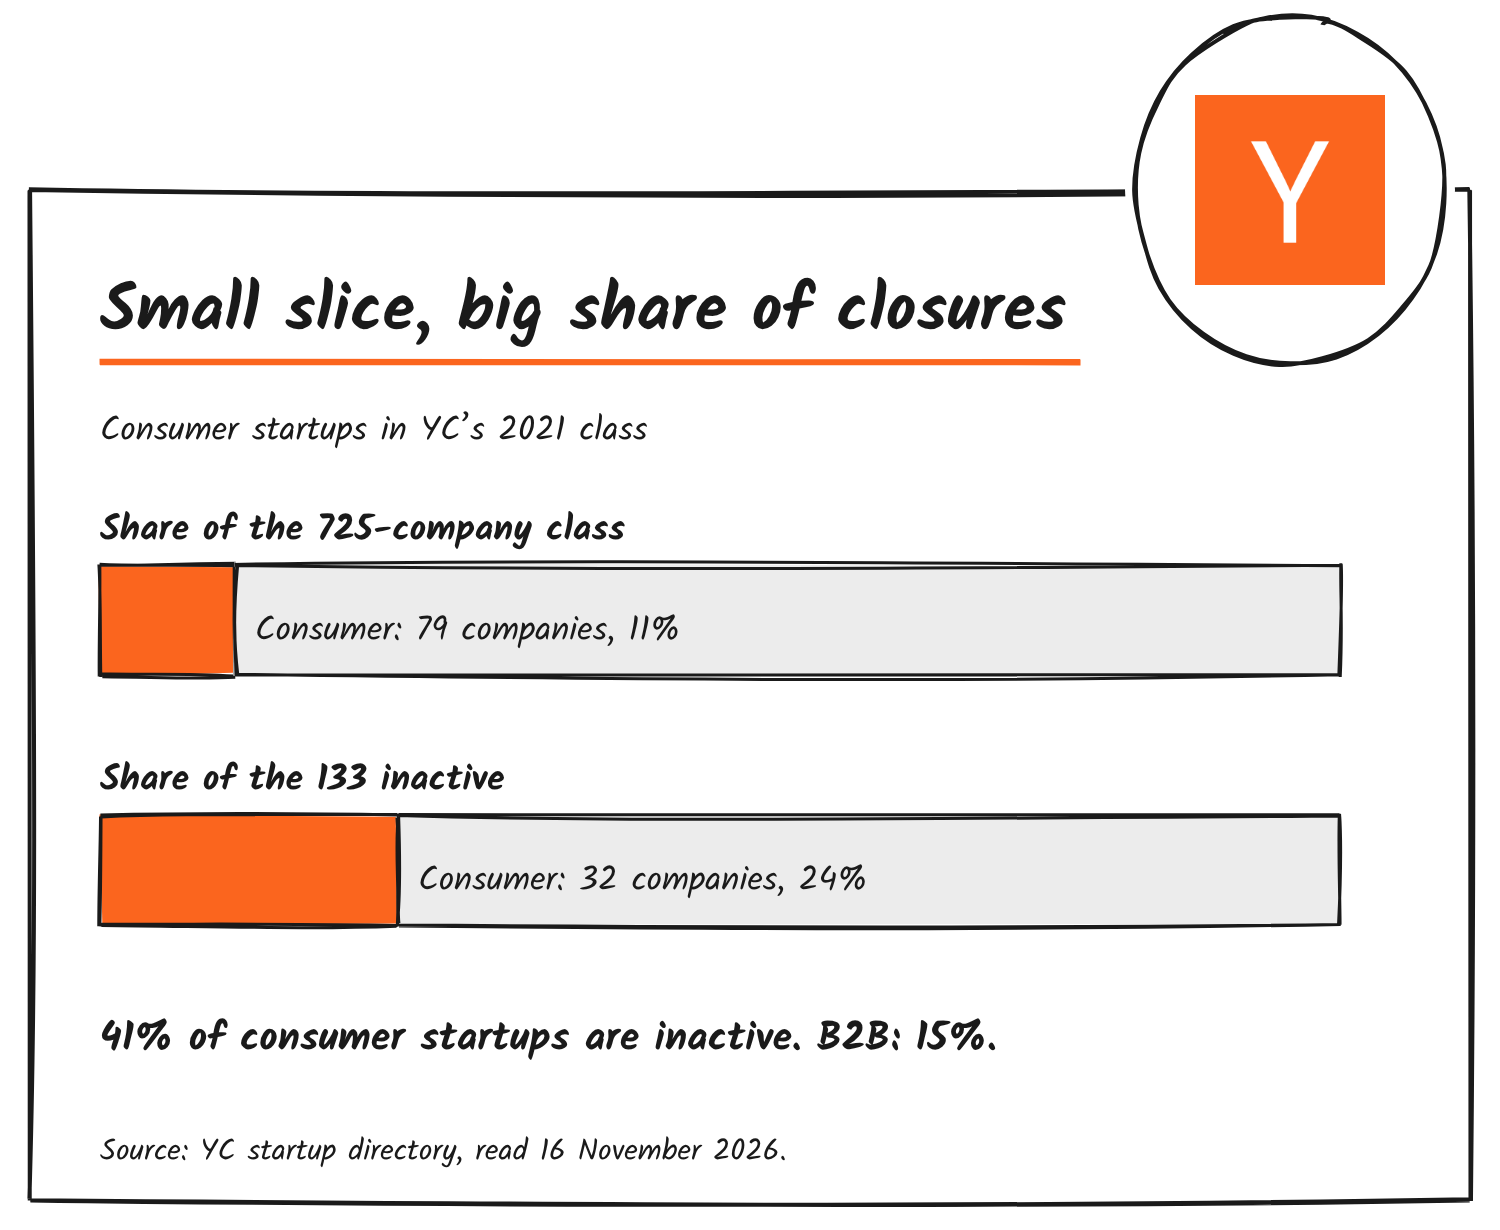
By the directory’s industry labels, Consumer has 79 of the 725 companies, 11% of the class. It has 32 of the 133 Inactive companies, 24% of them. Inside Consumer, 41% of companies are Inactive. B2B is the largest group, with 341 companies, and 15% of them are Inactive.
Both batches show it. Winter 2021 has 39 Consumer companies and 18 are Inactive (46%). Summer 2021 has 40 and 14 are Inactive (35%). Acquisitions tilt the other way: B2B has 51 of the class’s 84 Acquired companies (61%), while Consumer has seven (9%).
| Industry | Companies | Inactive | Share Inactive |
|---|---|---|---|
| B2B | 341 | 52 | 15% |
| Fintech | 114 | 23 | 20% |
| Healthcare | 104 | 12 | 12% |
| Consumer | 79 | 32 | 41% |
| Industrials | 43 | 6 | 14% |
| Education | 28 | 5 | 18% |
| Real Estate and Construction | 14 | 3 | 21% |
| Government | 2 | 0 | 0% |
Real Estate and Construction is next at 21% (three of 14), then Fintech at 20% (23 of 114) and Education at 18% (five of 28). Healthcare is lowest among the groups with more than 100 companies, at 12% (12 of 104).
Food and drink closed most; supply chain didn’t close at all
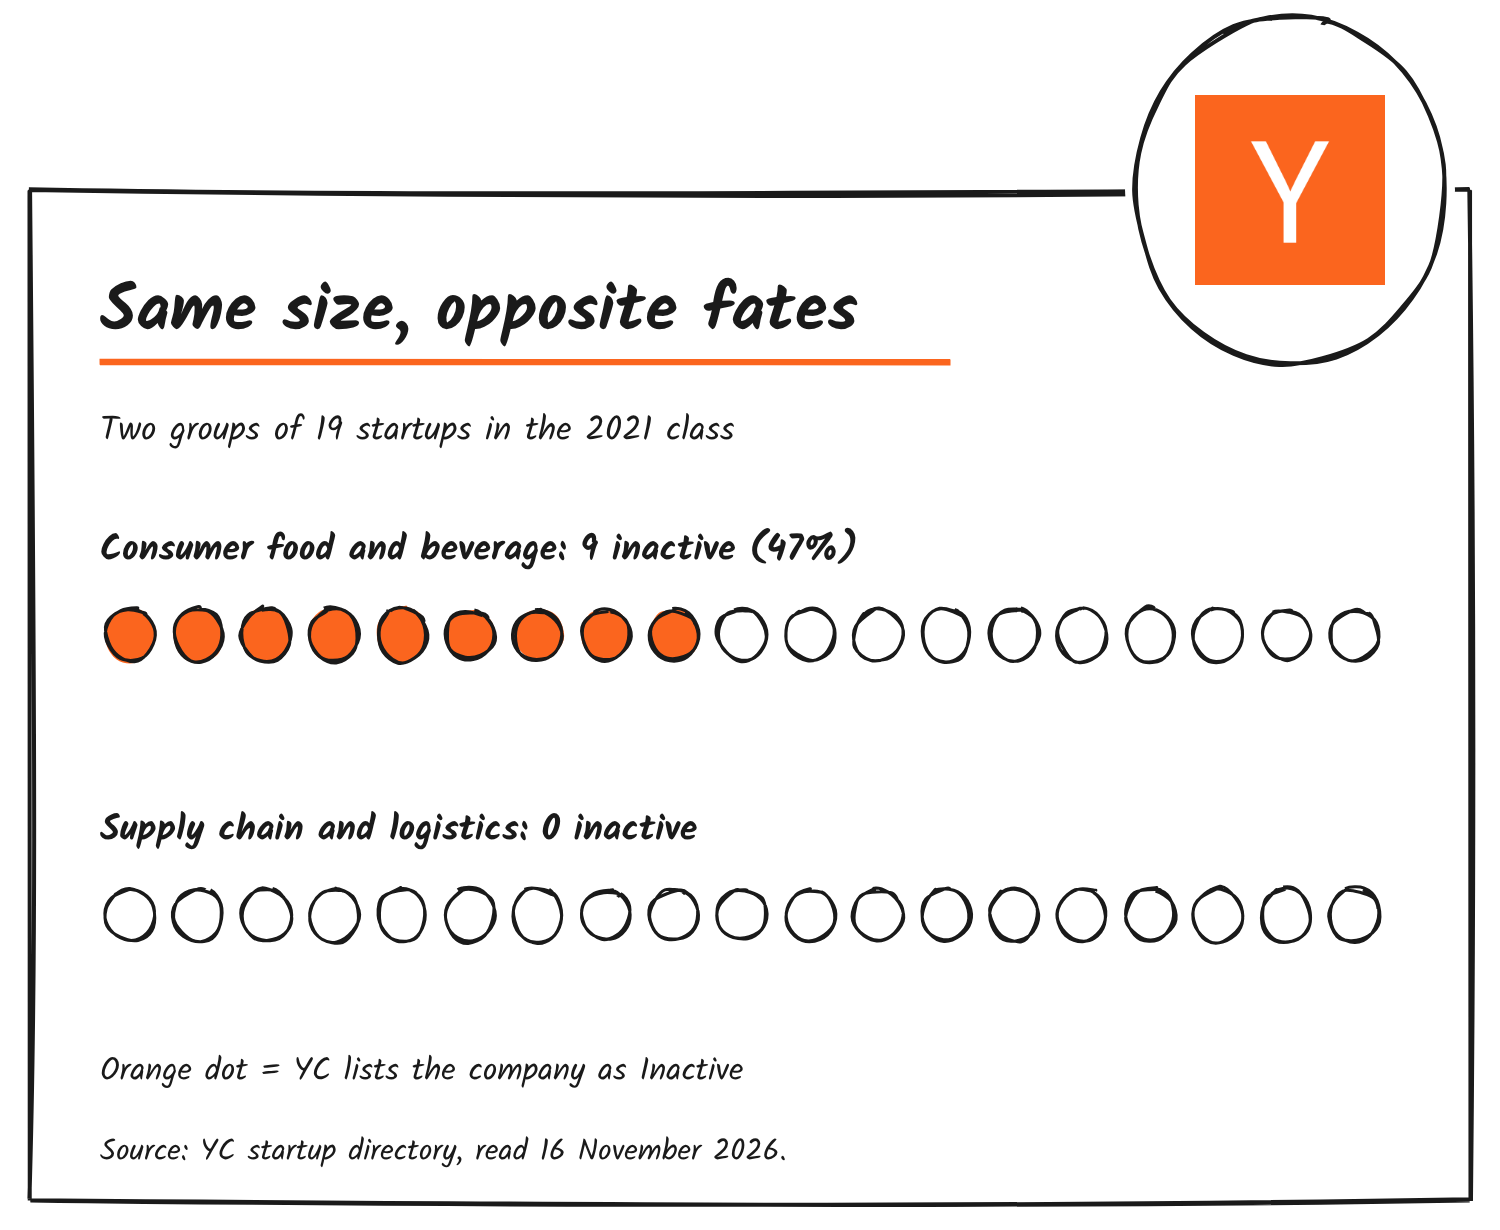
The directory also splits each industry into subsectors. Consumer food and beverage has 19 companies and nine are Inactive, or 47%. Supply chain and logistics, a B2B subsector, also has 19, and none is Inactive. Therapeutics (12 companies), aviation and space (12), drug discovery and delivery (nine) and manufacturing and robotics (seven) have no Inactive companies either.
| Subsector | Companies | Inactive | Share Inactive |
|---|---|---|---|
| Consumer: Content | 7 | 5 | 71% |
| Consumer: Home and Personal | 10 | 5 | 50% |
| Consumer: Food and Beverage | 19 | 9 | 47% |
| B2B: Supply Chain and Logistics | 19 | 0 | 0% |
| Healthcare: Therapeutics | 12 | 0 | 0% |
| Industrials: Aviation and Space | 12 | 0 | 0% |
Content and home and personal have seven and 10 companies, so a handful of closures moves the share a long way.
How to check the numbers
The directory’s filters take a batch and a status, so Winter 2021 plus Inactive returns that batch’s Inactive companies, and the same filter on Summer 2021 returns the rest. For the whole class at once, the yc-oss mirror publishes every company as JSON with batch, status, industry and subindustry fields. This script prints the 2021 status counts used above:
import json, urllib.request, collections

url = "https://yc-oss.github.io/api/companies/all.json"
rows = json.load(urllib.request.urlopen(url))

counts = collections.Counter(
    r["status"] for r in rows if "2021" in r["batch"]
)
print(counts)  # Active 508, Inactive 133, Acquired 84
Swap status for industry or subindustry to rebuild the tables. The mirror is a snapshot, so a later run can differ from the 16 November figures.
An earlier count of the same class
Synaptic, which tracks how each YC cohort performs, reviewed the 2021 batches in December 2025. It counted 727 startups, 535 of them active and 81 acquired. The directory now lists 725 companies, 508 Active and 84 Acquired, so Active is down 27 and Acquired is up three. Synaptic also reports that about 19% of the 2021 class reached Series A or later, against about 33% for 2020’s class.
What the directory doesn’t show
The listing gives each company one status label. It carries no date for when a company became Inactive and no reason, so the counts show how many companies are labelled Inactive, not when or why. YC’s year in review counted 750 funded companies for 2021 and the directory lists 725, so the percentages above are shares of the listed companies.
The 2022 class is next in line: the directory lists 631 companies for it, and 90 are Inactive (14%) as of 16 November 2026.
Discover more from Sulat AI & Tech News
Subscribe to get the latest posts sent to your email.