
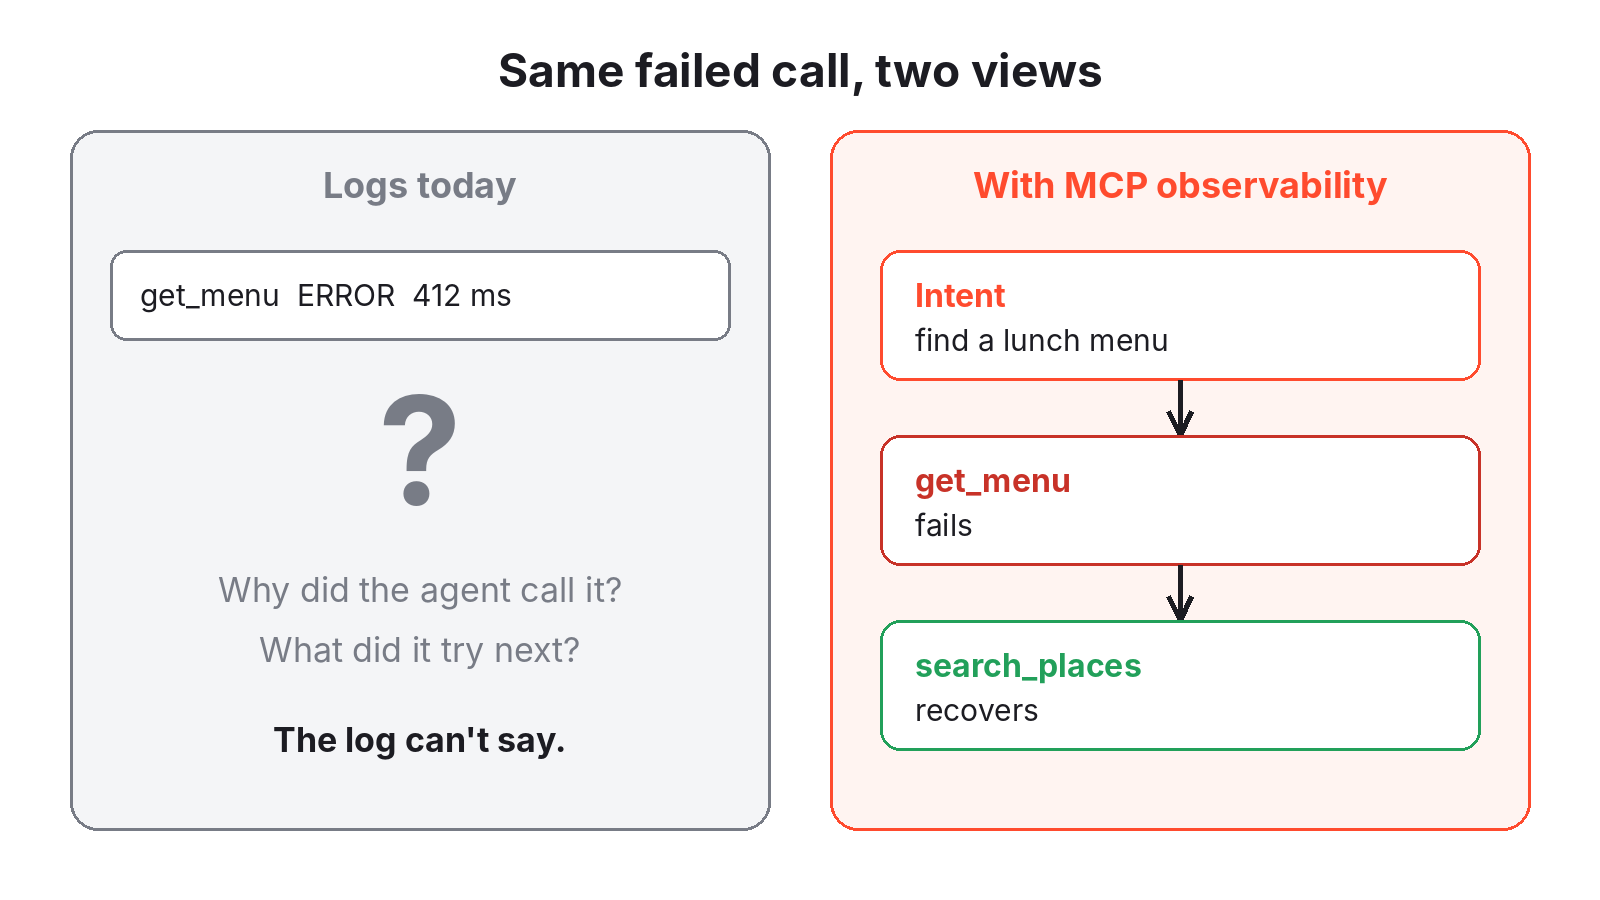
Judgment Labs has added MCP Observability, which records each tool call on an MCP server you run as a trace span and groups the calls into sessions. The company announced it on X on 18 November, aiming it at a gap MCP authors know well. You write tool descriptions and error messages and hope agents use them properly. When they don’t, your logs show the error, not what the agent was trying to do or what it did next. The setup steps are in Judgment’s MCP tracing docs.
What it records
Every tool execution logs its server name, tool name, duration and outcome. Open a span and you can inspect the call plus any instrumented work inside the tool, which appears as child spans. The integration doesn’t instrument database clients or other libraries on its own. Each request starts a new trace unless it arrives with trace context such as params._meta.traceparent, in which case the tool call becomes a child of the incoming trace. It also notes the client’s reported name and version, which identify the software and not the signed-in user.
Judgment’s X thread describes three views. One shows the whole MCP at a glance: calls, failures, latency and which agents use it. Another opens a single tool to show how often it fails, how often agents recover and what they call before and after it. The third follows one session step by step to find where the agent got stuck. In the app, they sit under MCP in the Monitoring sidebar as Overview, Tools, Failures, Sessions and Calls. Judges and Issues run on the whole trace that contains the MCP span, not only the span itself.
The agent supplies its own intent
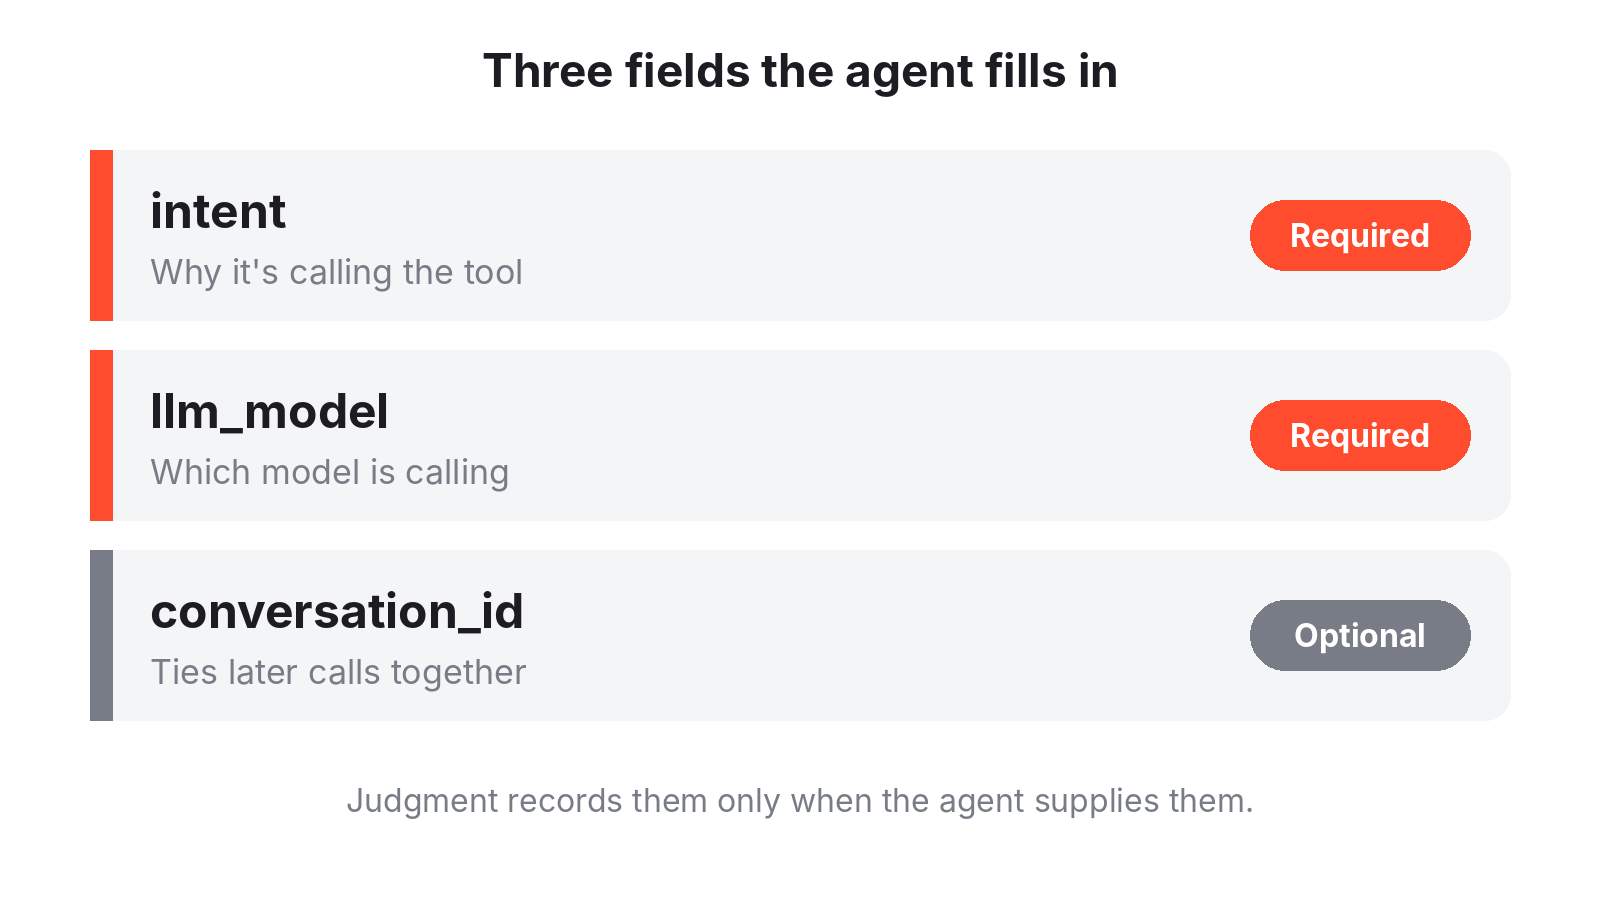
The server can’t know why a call happened, so the agent has to say. By default the SDK adds fields to compatible tool input schemas and asks the calling agent to fill them in. intent and llm_model are advertised as required, and conversation_id as optional. The SDK strips them before your handler runs, and calls that leave them blank are still executed and traced. Judgment records intent and model only when the agent sends them, and the model name is whatever the agent reports, unverified.
If a tool already has its own intent field, that field is left alone and isn’t read as telemetry unless you point the SDK at it with intent_argument in Python or intentArgument in TypeScript. Setting inject_agent_arguments=False turns the whole thing off and records calls without changing any schema.
How calls become a session
A session ties together the calls from one conversation, and the SDK picks the ID in a fixed order:
- An application session from your
session_idcallback, request-scoped tracing context or an explicitly chosen existing conversation field. - A conversation ID the agent echoes back.
- An ID generated for this call, when conversation injection is on and the tool schema supports it.
- The MCP transport session ID, when there is one.
The first call gets a generated ID, and the result asks the agent to repeat it on later calls. When the agent doesn’t, each eligible call gets a different ID. A call that throws has no result to carry that request, so a failed first call can land in a session of its own. If your application already knows the conversation ID, return it from the callback and you don’t depend on the agent at all.
Setting it up
Python needs judgeval 1.9.0 or later and TypeScript needs 1.8.1 or later. Python covers the official mcp SDK in versions 1.x and 2.x plus standalone fastmcp. TypeScript covers @modelcontextprotocol/sdk 1.x and @modelcontextprotocol/server 2.x. Both handle high-level servers and the low-level Server API. In Python the change is two lines after you initialise tracing:
from judgeval import Tracer
from judgeval.integrations.mcp import instrument_mcp_server

Tracer.init(project_name="lunch-order-agent", environment="development")
instrument_mcp_server(server)
Judgment’s “one prompt” route hands that job to your coding agent:
Instrument this repo's MCP server with Judgment by following https://docs.judgmentlabs.ai/documentation/tracing/integrations/mcp.mdThis instruments a server you operate. It doesn’t trace the client side of an MCP connection. Judgment’s pricing page lists trace ingest at $1.50 per GB after the first 1 GB on the free Beginner plan, and $0.50 per GB after 50 GB on Pro, which costs $250 a month.
What it keeps, and what it doesn’t
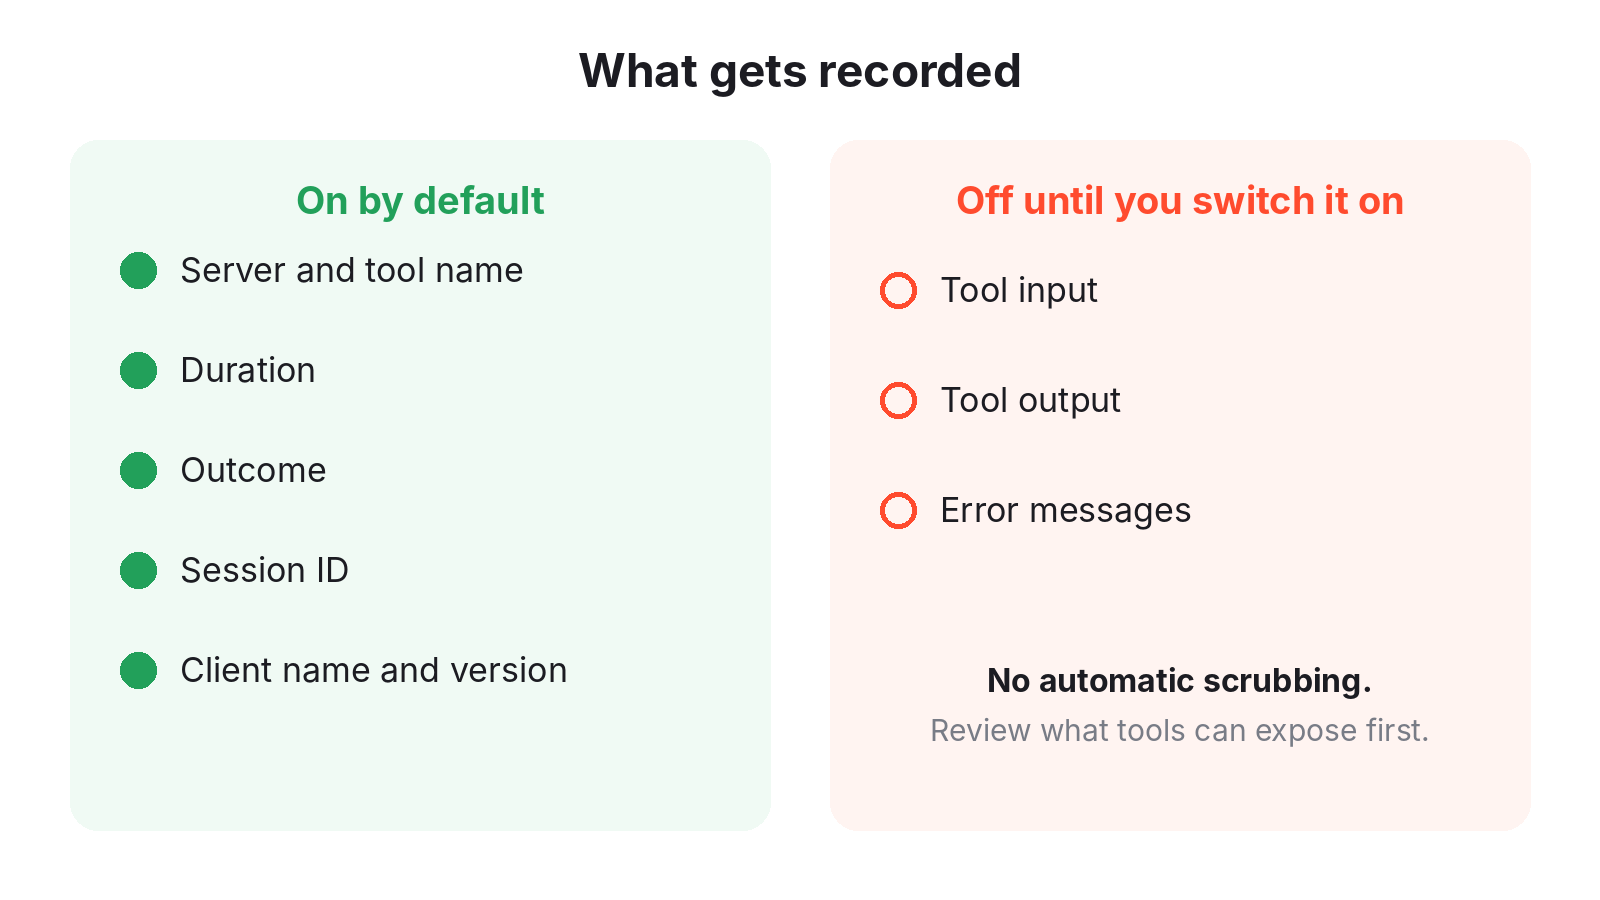
Input, output and error-message capture are all off by default. Agent-reported intent is recorded whenever the agent supplies it. Turning capture on takes capture_input, capture_output or capture_error_messages, and redact_payload and redact transform what’s captured before export. The SDK doesn’t scrub anything by itself, so what your tools return is what gets stored once capture is on.
What changes in your server
Argument injection edits tool schemas and tool results even when trace export is off, and it adds text to the agent’s context. A strict client can reject a result after deployment because output schemas change too, so refresh cached tool listings and keep replicas on compatible schemas while you roll out. Low-level servers have to expose their original schemas, or supply resolve_original_tool in Python or resolveOriginalTool in TypeScript for a request-scoped lookup. If an MCP framework turns an exception into a tool-error result before the SDK sees it, the error type shows as tool_error. Servers that already emit OpenTelemetry spans for each tool execution can keep them and map the attributes, so each execution isn’t recorded twice.
Discover more from Sulat AI & Tech News
Subscribe to get the latest posts sent to your email.