
Businesses are buying much more AI, and two familiar products account for most of the application market: coding tools and workplace chatbots.
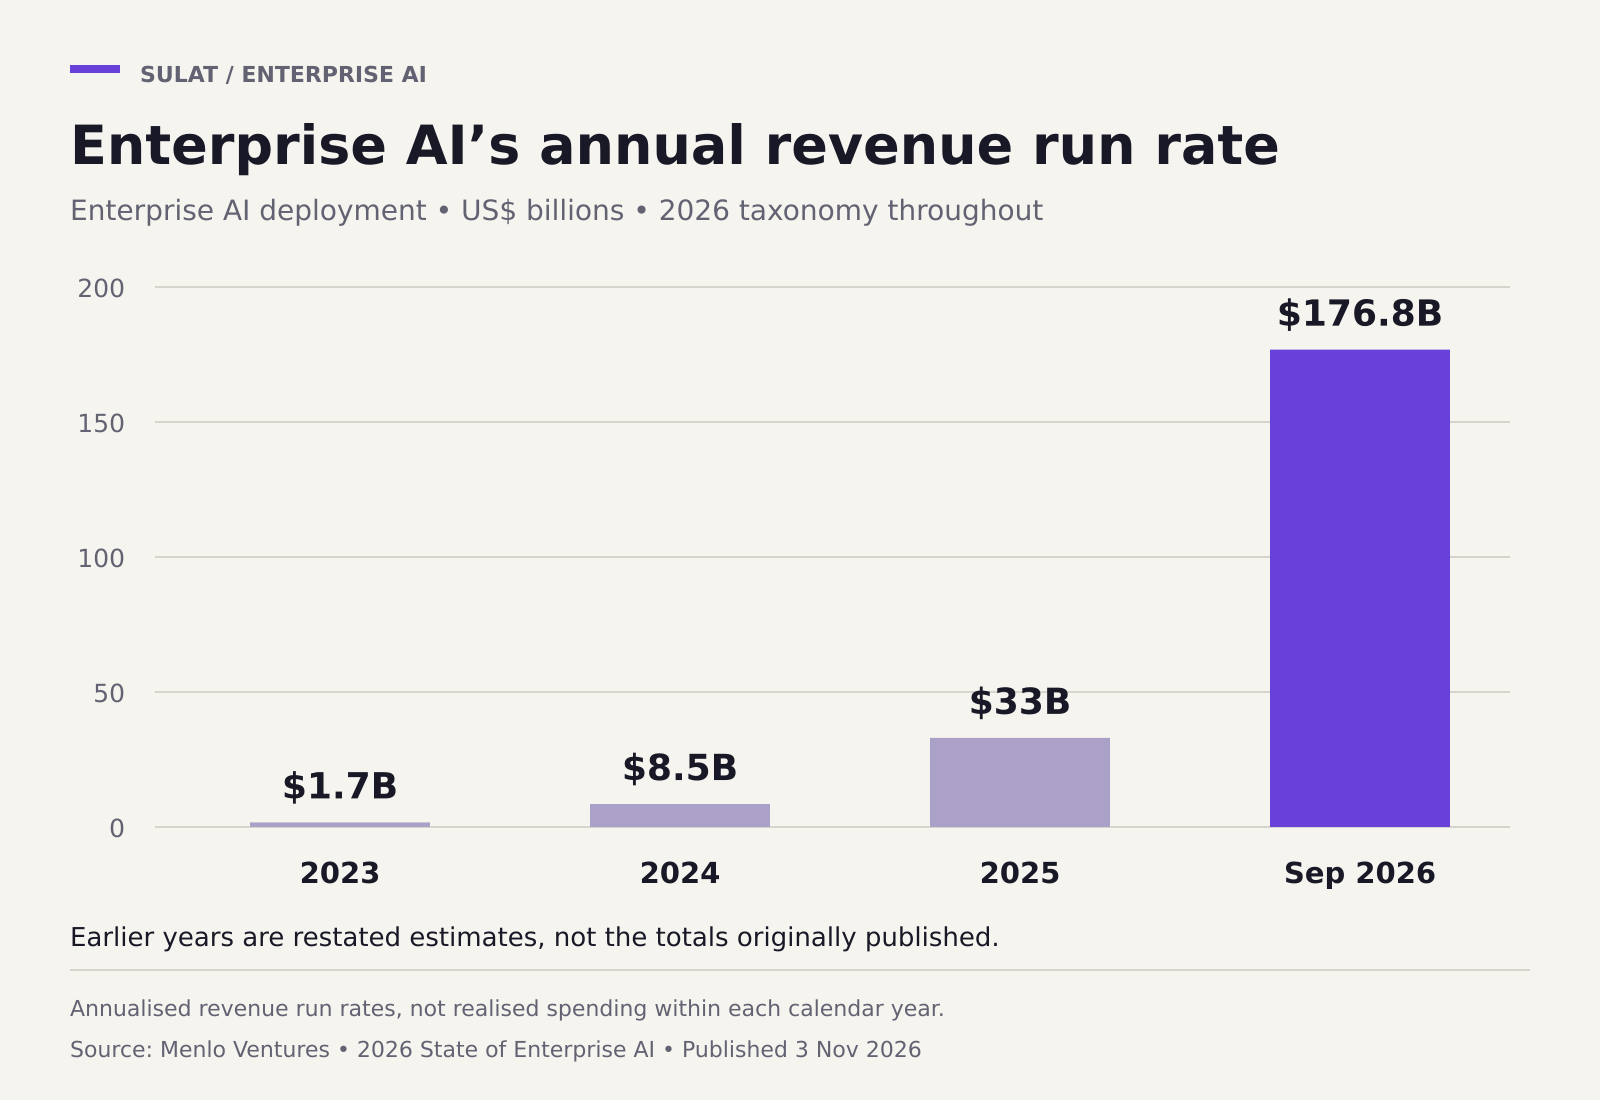
Menlo Ventures estimates that enterprise spending on deploying generative AI reached an annualised revenue run rate of $176.8 billion by September 2026, up from a restated $33 billion in 2025. Coding accounts for $34 billion and chatbots for $25 billion, together making up 76% of its $77.3 billion application estimate.
The report, published on 3 November, draws on a survey of nearly 400 US enterprise decision-makers and a market model incorporating public filings and other research. Its headline expresses revenue at a yearly pace as of September. It does not mean businesses had already spent $177 billion during 2026. All dollar figures below are US dollars.
Transaction data from Ramp and research from the US Census Bureau and McKinsey add detail about who is using AI and how unevenly it is spreading. They measure different populations and activities; none independently verifies Menlo’s market total.
What sits inside the $177 billion
Menlo divides deployment into $99.5 billion of infrastructure and $77.3 billion of applications. Infrastructure covers inference, which runs trained models, and the services supporting agents. Applications include coding assistants, chatbots and industry-specific software.
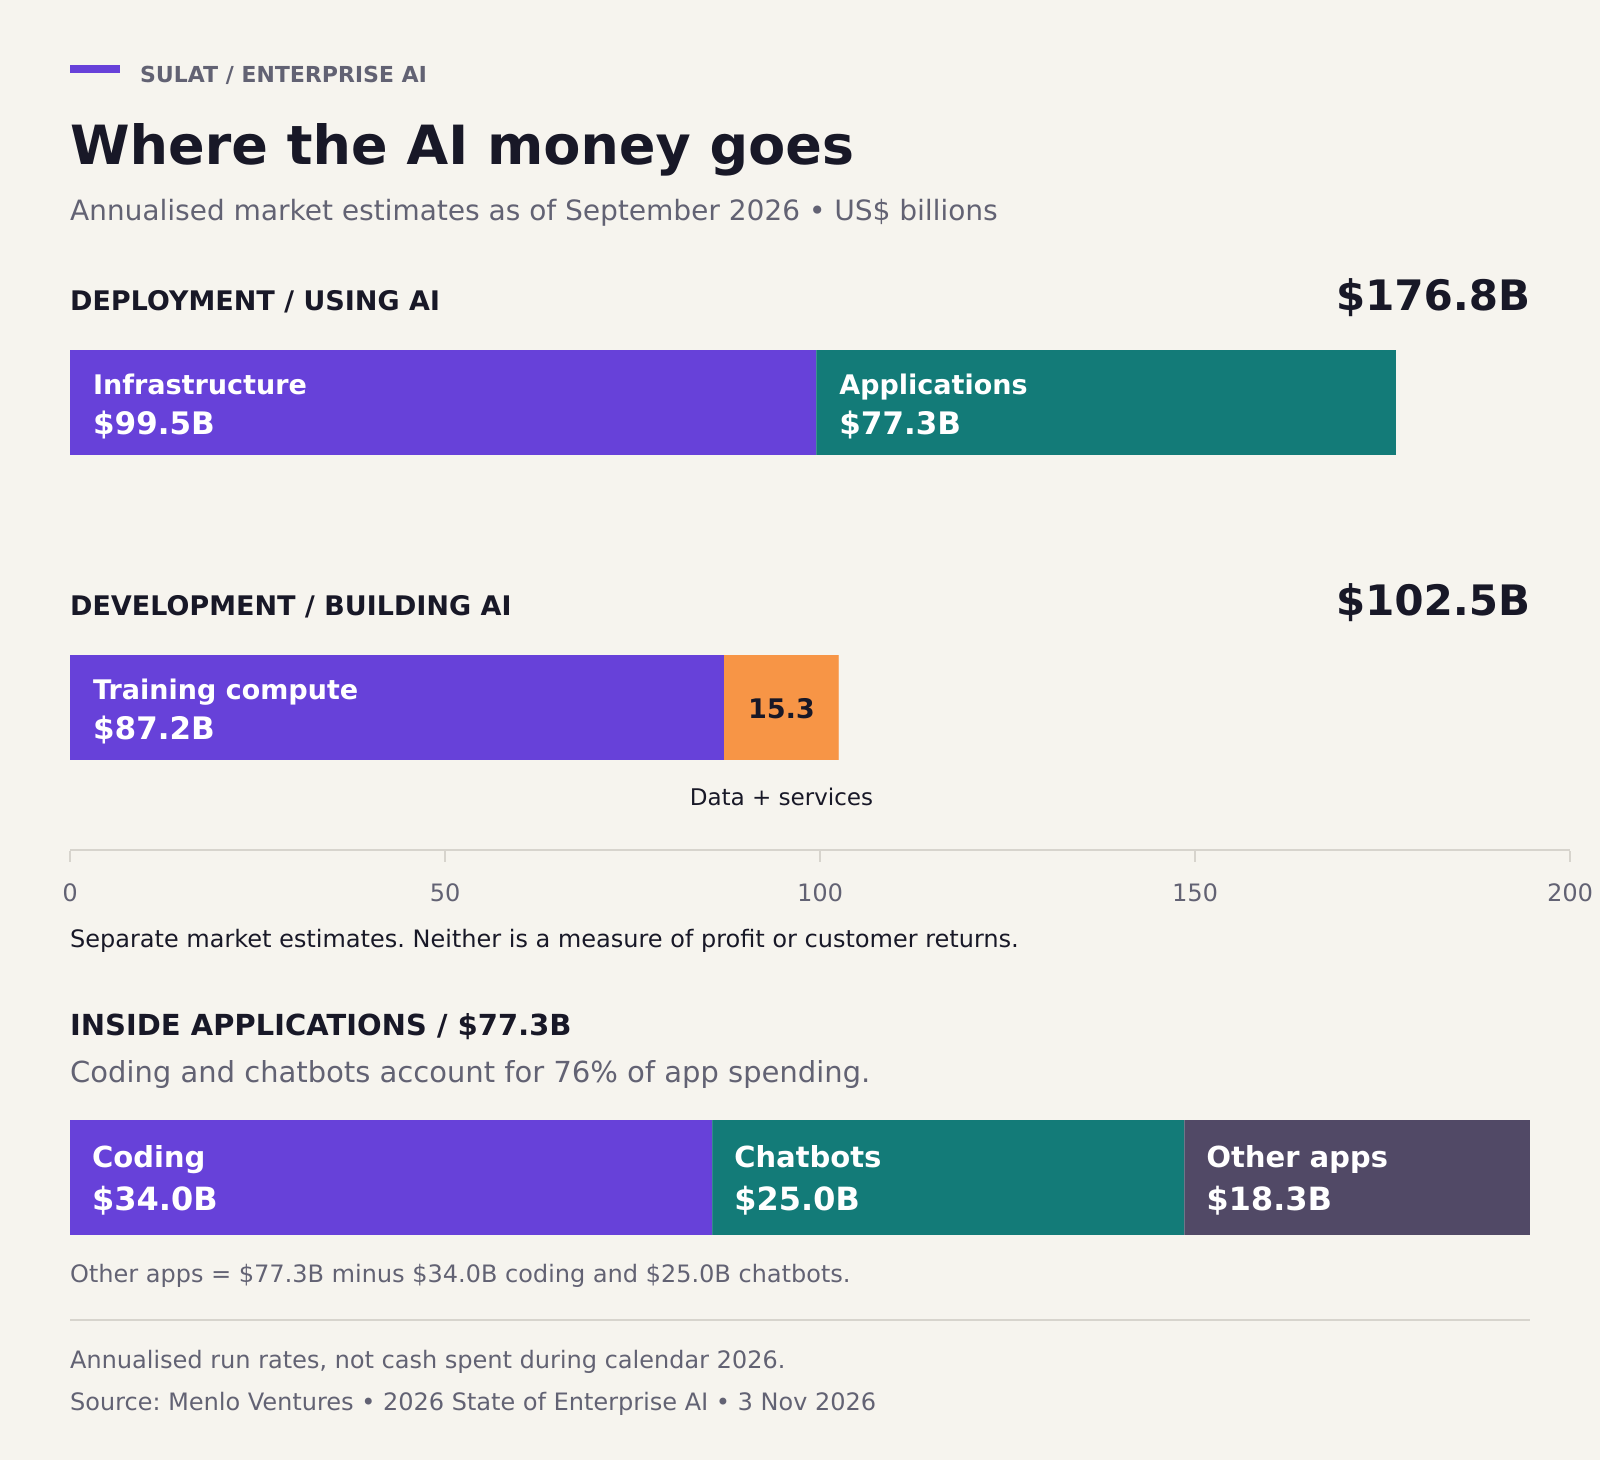
The firm separately estimates $102.5 billion for developing models: $87.2 billion in training compute and $15.3 billion in training data and services. Those development figures sit outside the deployment headline.
This is the basis for Menlo’s claim that AI generates about $1.70 in deployment revenue for every dollar spent on development. The calculation compares the size of two markets. It does not measure profit, an investor’s return or the productivity a customer gets from an AI purchase. Those require evidence about costs and outcomes beyond these revenue estimates.
There is also a change in accounting between editions. Menlo moved data-labelling companies such as Mercor from deployment to development and reclassified earlier years to match. The $33 billion baseline belongs to the revised series, so comparisons should use that series throughout.
Coding takes the largest slice
Coding’s $34 billion puts it ahead of every other application category in the report. Menlo estimates that Claude Code and OpenAI’s Codex together account for $24 billion, about 70% of coding spend. The rest of the category still grew roughly 2.9 times to about $10 billion, including independent coding platforms and app builders.
The report attributes coding’s growth to the conditions in which agents operate: access to repositories and tools, examples of previous work, and tests that can check their output. Those conditions make it easier to automate a sequence of actions than in work with ambiguous inputs or subjective outcomes. This is Menlo’s explanation for the spending pattern, rather than a causal finding from the survey.
Buying a coding product also involves different pricing arrangements. Sulat’s comparison of OpenCode Go, Claude Code, Codex and other coding tools examines how subscriptions, usage allowances and direct API charges differ. The market total combines products whose bills grow in different ways.
The largest labs sell both models and applications. Menlo estimates that Anthropic, OpenAI and Google receive 69% of all deployment dollars. Within the narrower market for production model APIs, it puts Anthropic at 55%, OpenAI at 31% and Google at 9%. Menlo derives those API shares from respondents’ reported workload mix, weighted by AI spending. They are estimates of spending share, rather than counts of customers or tokens.
The average buyer is growing faster than the middle buyer
Menlo’s budget findings show how much the heaviest users influence the picture. Respondents reported average spending of 4.7 times the previous year’s level, against a planned 1.9 times. At the median, reported spending reached 2.2 times the previous year, against a planned 1.8 times.
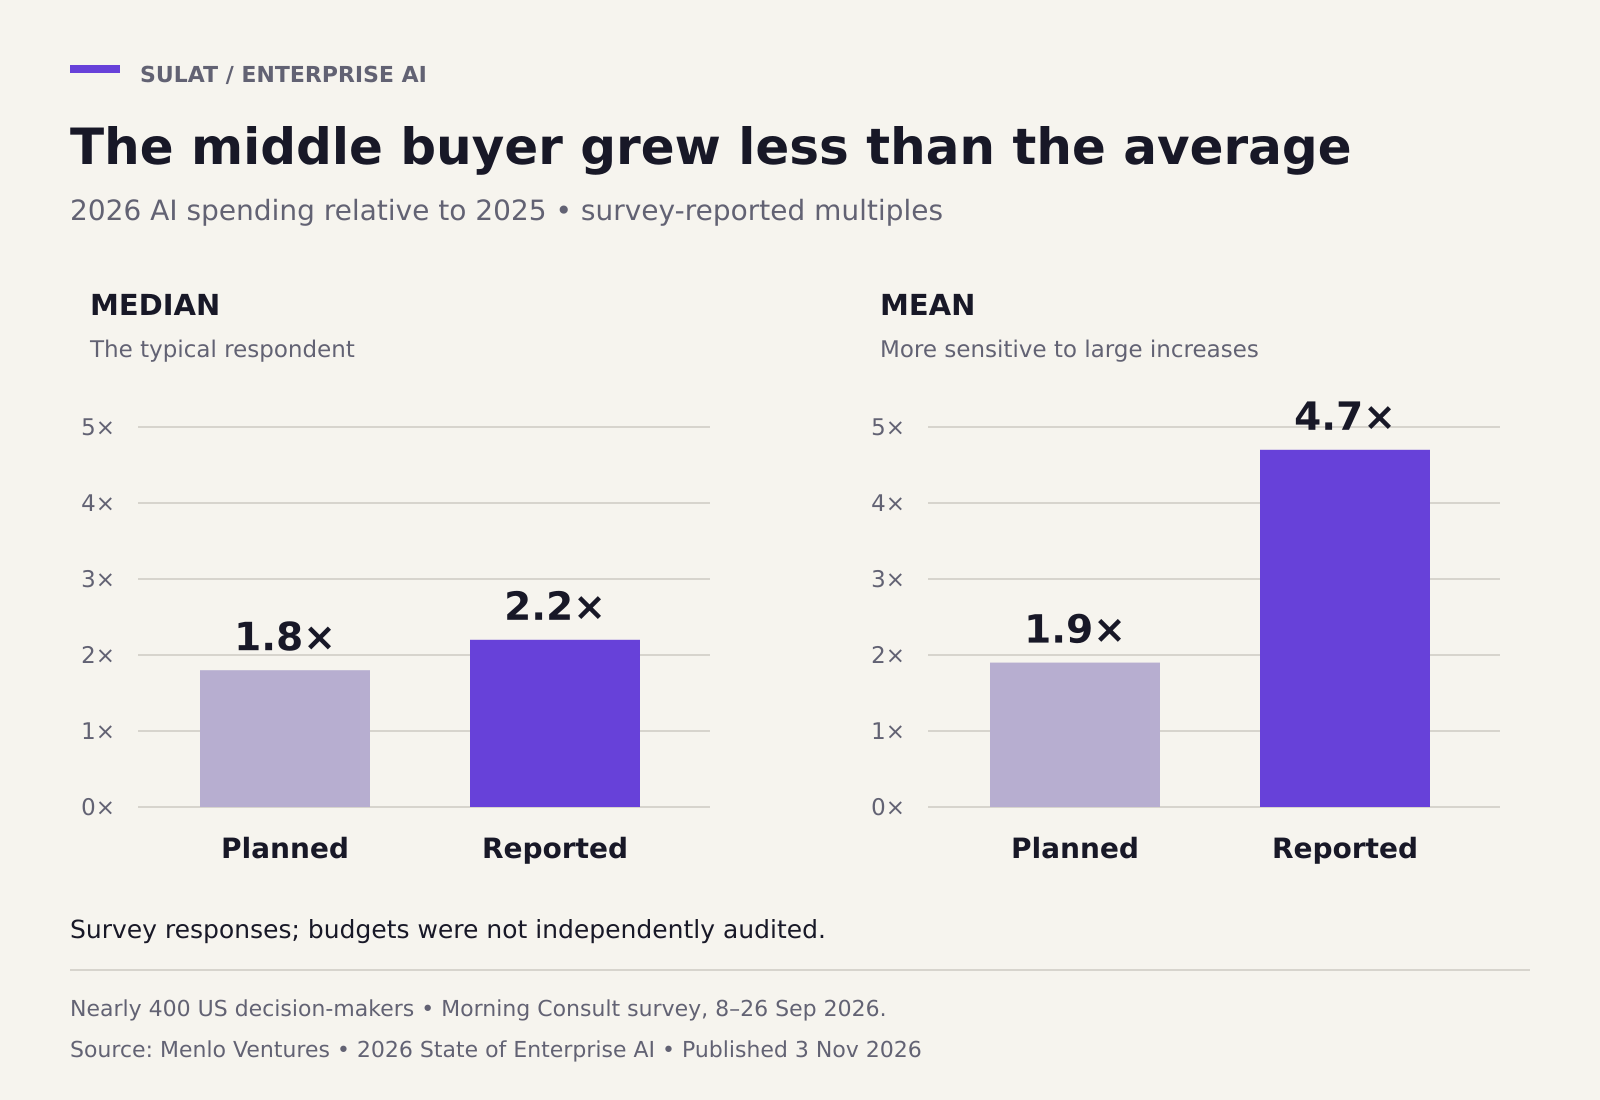
Both measures exceeded plans, but by very different amounts. The mean was about 2.5 times the planned level; the median was about 22% above it. Presenting only the average would make the typical company’s expansion look much larger.
Ramp’s September data, published on 14 October, provides a separate view from observed purchases. It found that 55.9% of businesses in its sample paid for AI during the month. Its live index records a rise of 12.1 percentage points from a year earlier.
Among firms paying for AI, the index reported median monthly spend of $15.70 per employee. The median within the highest-spending tenth was $813.43 per employee. That second figure describes the middle firm within the top group, not the threshold needed to enter it.
Ramp’s index draws on more than 85,000 American businesses using its platform. It misses free tools and purchases made through employees’ personal accounts, and its customers are not a representative sample of every US business. Its data nevertheless gives an independently collected example of the wide spread in spending intensity. Menlo also names Ramp among the inputs to its token-economics model.
Menlo also finds that new budgets funded 55% of the increase in AI spending. That denominator matters: the finding concerns incremental spending, rather than 55% of the entire $176.8 billion market. A further 22% of the increase came from existing software budgets.
Adoption depends on which businesses are counted
Menlo reports enterprise adoption rising from 55% to 65%. The Census Bureau’s wider view of US businesses produces a much lower number.
For the collection period ending 3 May, Census reported that 19.8% of businesses had used AI in any business function during the preceding two weeks. Use reached 37% among firms with at least 250 employees. These are dated May observations, rather than a reading of November adoption.
Company size, the kind of AI being counted and the time window all change the result. Census also broadened its question in November 2025 from AI used in producing goods or services to AI used in any business function, limiting comparisons across that change.
| Evidence | What is counted | What it can establish |
|---|---|---|
| Menlo, September 2026 | Enterprise deployment revenue at an annualised pace, estimated from a market model | The estimated size and composition of an AI market |
| Ramp, September 2026 | Businesses in its customer sample with observed AI payments that month | Paid adoption and spending intensity within that sample |
| Census, period ending 3 May 2026 | US businesses reporting AI use in any function during the previous two weeks | Broad business use, including differences by size and sector |
| McKinsey, May–June 2026 survey | Respondents’ accounts of organisational deployment and outcomes | Reported progress in scaling AI and its business effects |
Token counts answer another question again. Menlo says agents accounted for 80% of tokens on OpenRouter in the data it examined. The series classifies traffic by API-key type and covers one gateway whose users skew towards developers and startups. A token share cannot establish that 80% of businesses use agents, or that agents complete 80% of their work.
Spending and business results need separate evidence
In its 2026 State of AI survey, McKinsey found that 44% of respondents reported enterprise-wide AI scaling, up from 38% a year earlier. The study surveyed 1,719 participants in 97 countries from 4 May to 8 June and weighted responses by countries’ contributions to global GDP.
Separately, 37% of respondents attributed at least some impact on enterprise earnings before interest and taxes to AI. These are respondents’ assessments, rather than audited returns. Scaling agents in one business function also differs from deploying them across an entire organisation.
There is more direct evidence for some individual tasks. A study published in the Quarterly Journal of Economics followed the staggered introduction of AI assistance for 5,172 customer-support agents at one software company. Access increased issues resolved per hour by 15% on average, with larger gains among less experienced and lower-skilled workers.
That system suggested responses while people retained control of conversations. The result concerns a specific support workflow and an earlier generation of AI assistance. It gives a measured example of productivity improvement without establishing a return for every product in Menlo’s much broader market estimate.
How the report was assembled
Morning Consult fielded Menlo’s survey from 8 to 26 September. Respondents were responsible for more than $4 billion of AI spending. Menlo built its market estimates from those responses, public filings and third-party reports; the published methodology does not provide respondent-level data or confidence intervals for the market totals.
Menlo is an investor in several companies discussed in the report, including Anthropic, OpenRouter, Factory and Fireworks. That financial interest belongs alongside its findings. Ramp also sells financial and spend-management services, while McKinsey sells consulting services; their research has different methods and commercial contexts.
Taken together, these sources describe growing AI purchases, substantial differences between businesses and demonstrated gains in some tasks. The open question is how much of the new spending becomes durable improvement in completed work, costs and company earnings. Menlo measures the expansion of the market. Establishing those outcomes requires following what buyers achieve with it.
Discover more from Sulat AI & Tech News
Subscribe to get the latest posts sent to your email.