

OpenAI’s API usage dashboard now shows rate limits, rate-limited requests and errors by model, project or API key, OpenAI Developers says. Usage and spend are in the same place, under Analytics.
OpenAI Developers posted it on X at 10:51pm UTC on 17 November, just before noon on 18 November in New Zealand, along with a 23-second demo video.
We updated the API usage dashboard to make it easier to monitor your usage and investigate issues.
— OpenAI Developers (@OpenAIDevs) November 17, 2026
In Analytics, you can now:
• Better track usage and spend
• Check rate limits and rate-limited requests
• Explore errors by model, project, or API key
What’s in Analytics
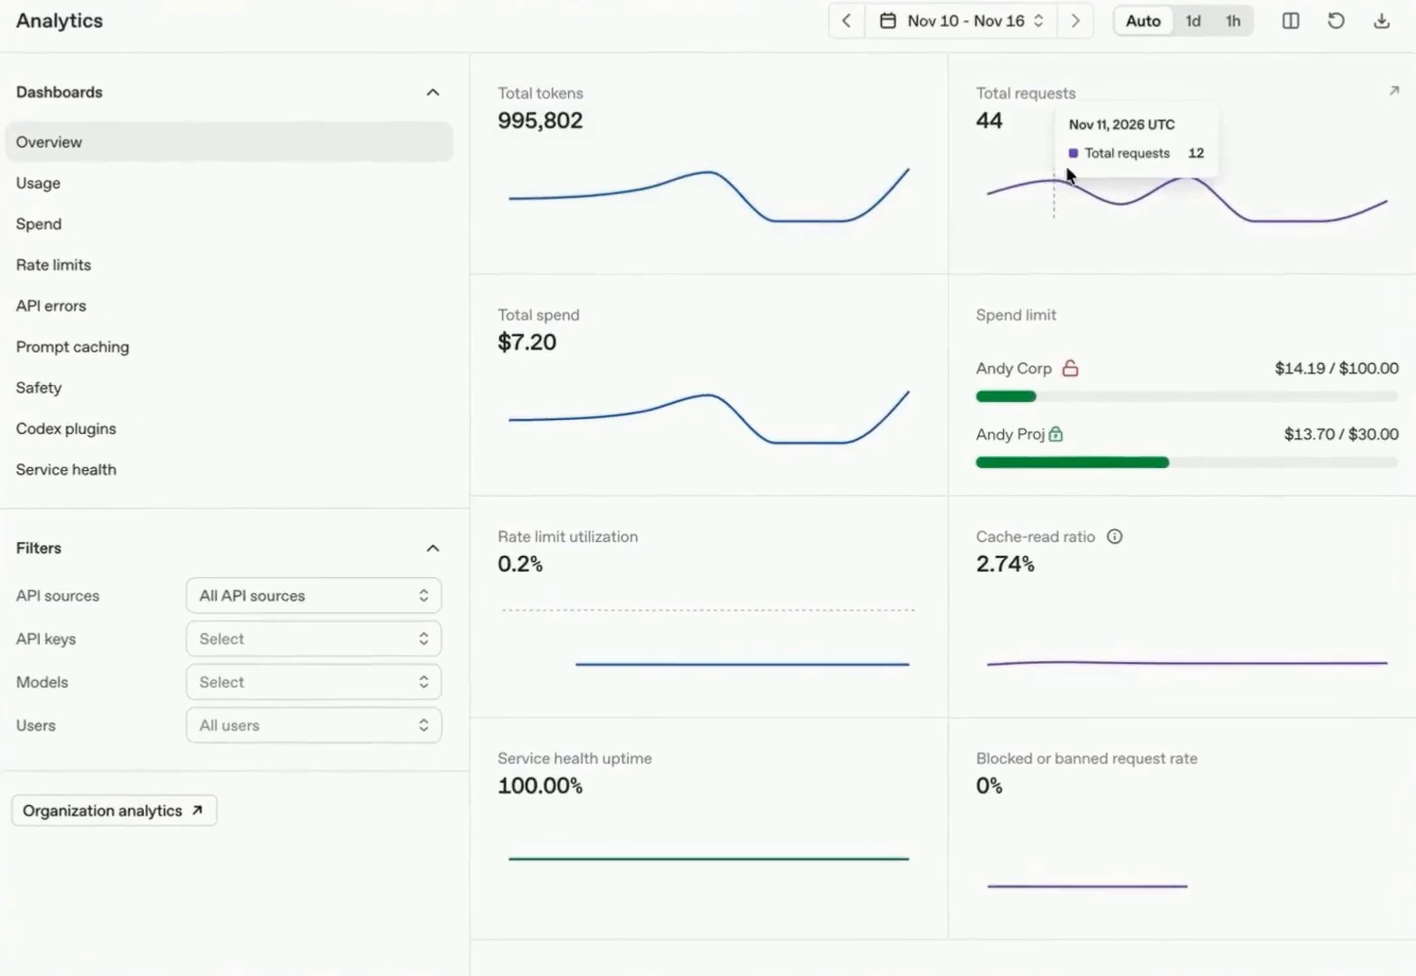
The demo opens on Analytics with a sidebar. Overview, Usage and Spend come first, then Rate limits and API errors, then Prompt caching, Safety, Codex plugins, Plugins and Service health. Filters for API sources, API keys, models and users sit below the list, next to a link to Organization analytics. Prompt caching (20 August) and Safety (23 June) were already in OpenAI’s changelog as separate launches.
The Overview page is a grid of eight tiles. They show total tokens, total requests, total spend, spend limits by project, rate limit utilisation, cache-read ratio, service health uptime and the blocked or banned request rate. The screenshots below are frames from OpenAI’s video, which OpenAI labels a prototype and fills with sample data.
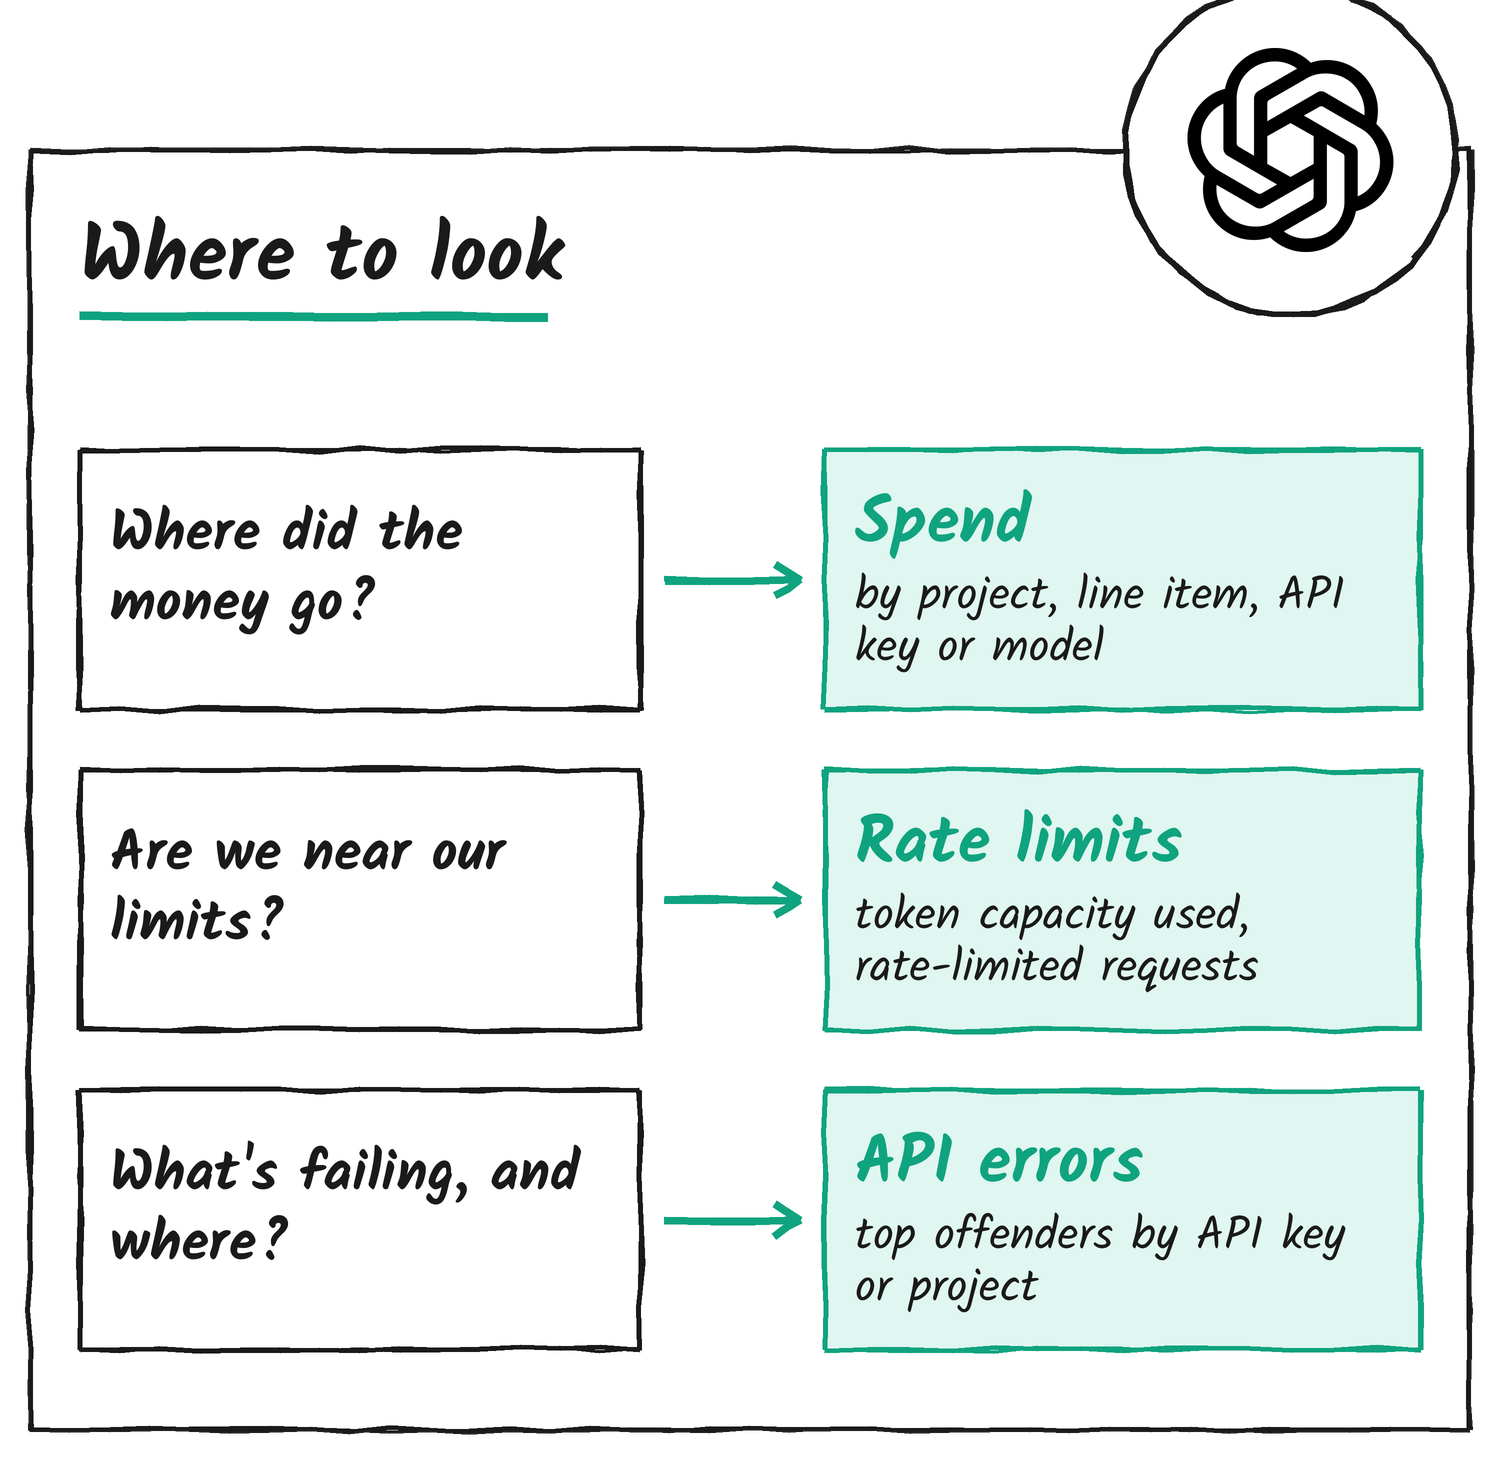
Rate limits and rate-limited requests
The Rate limits page shows how close you’ve run to your organisation’s token ceiling, counted in tokens per minute (TPM). Current usage, peak usage and the time spent at 95% or more sit at the top. A View rate limits button opens the limits themselves, and a second chart below counts the requests that were rate limited.
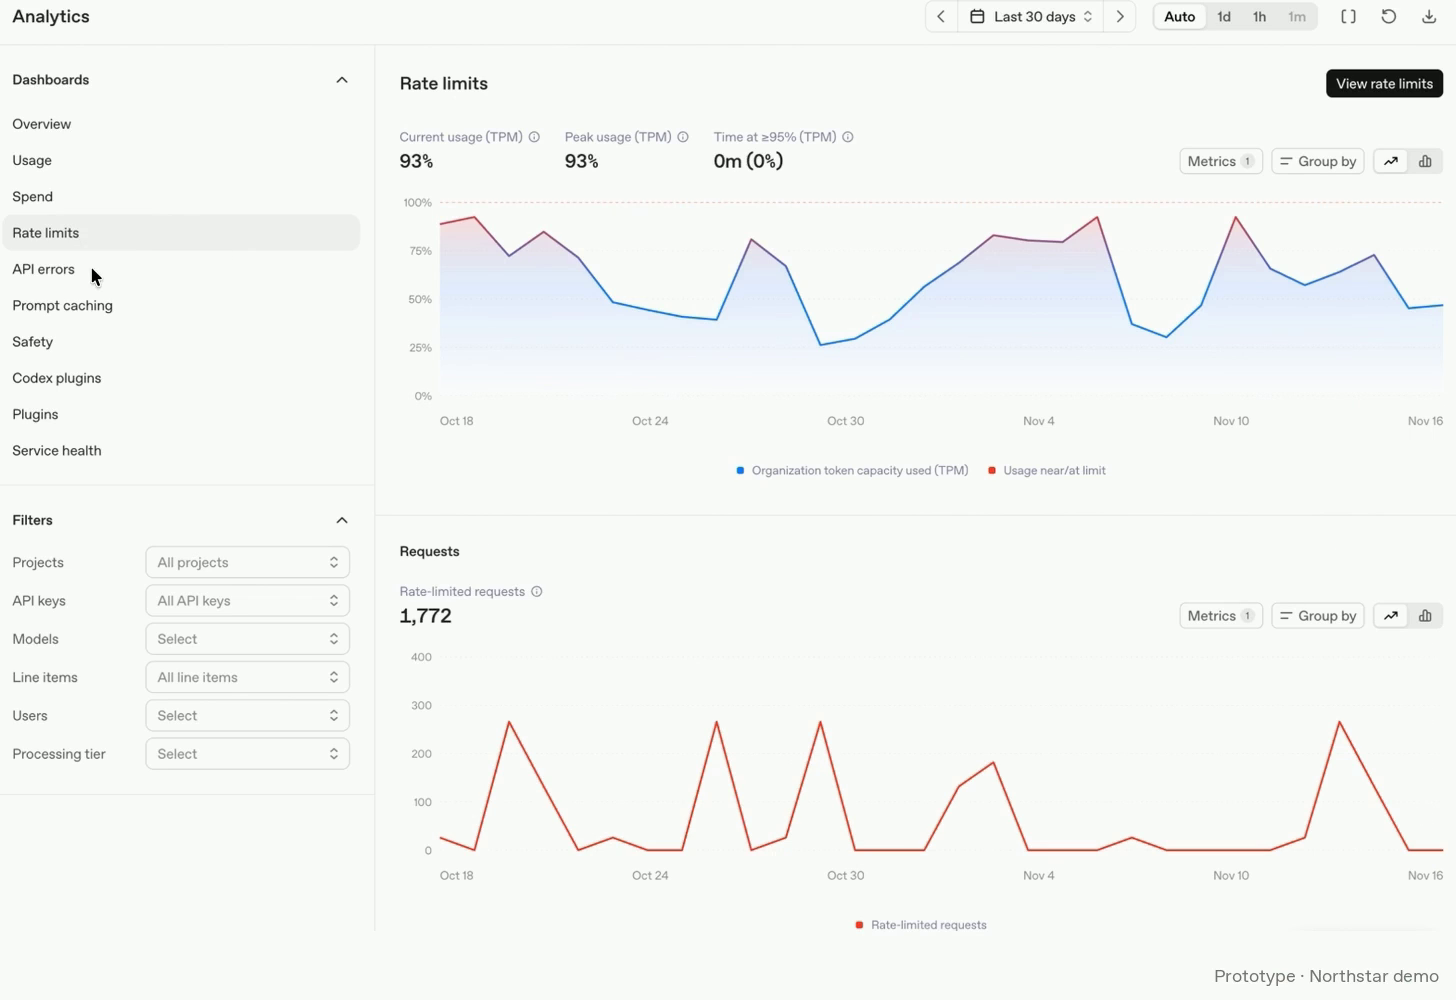
OpenAI’s rate limits guide explains where that ceiling comes from. It applies to the organisation and to each project, never to one user, and it changes with the model. Requests per minute and tokens per minute are two of the measures, and the first one you hit trips the limit. Filters narrow the page by project, API key, model, line item, user or processing tier.
Errors by key, project or model
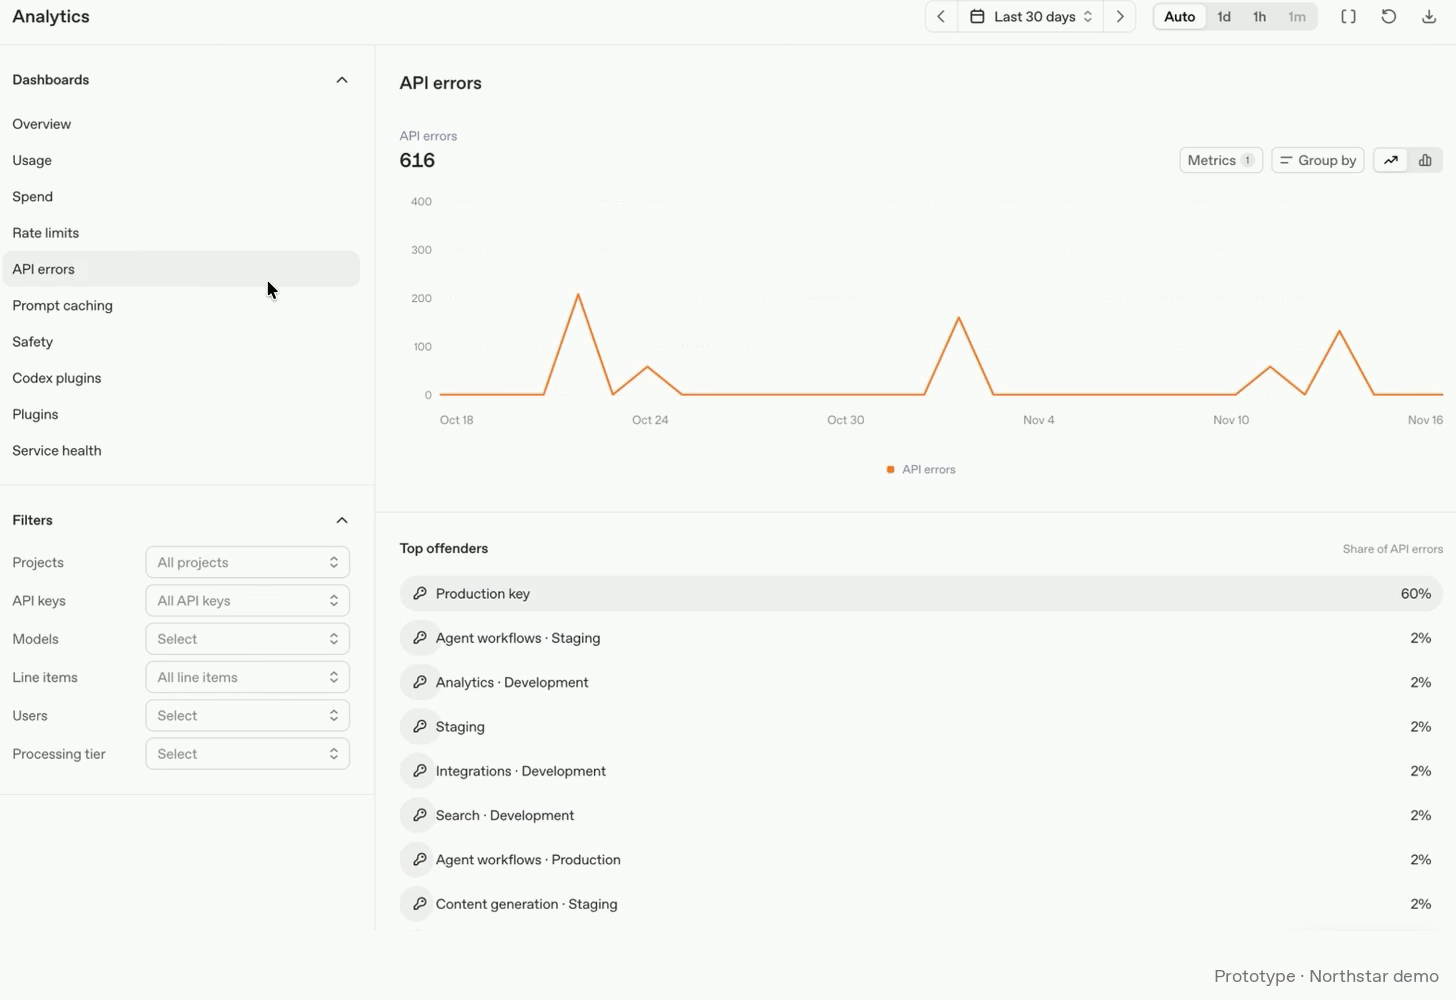
Errors get their own page. It plots the error count over time and lists the Top offenders below. In the demo those are API keys, ranked by their share of the errors. Per OpenAI Developers, you can explore errors by model, project or API key; the page filters cover projects, API keys and models.
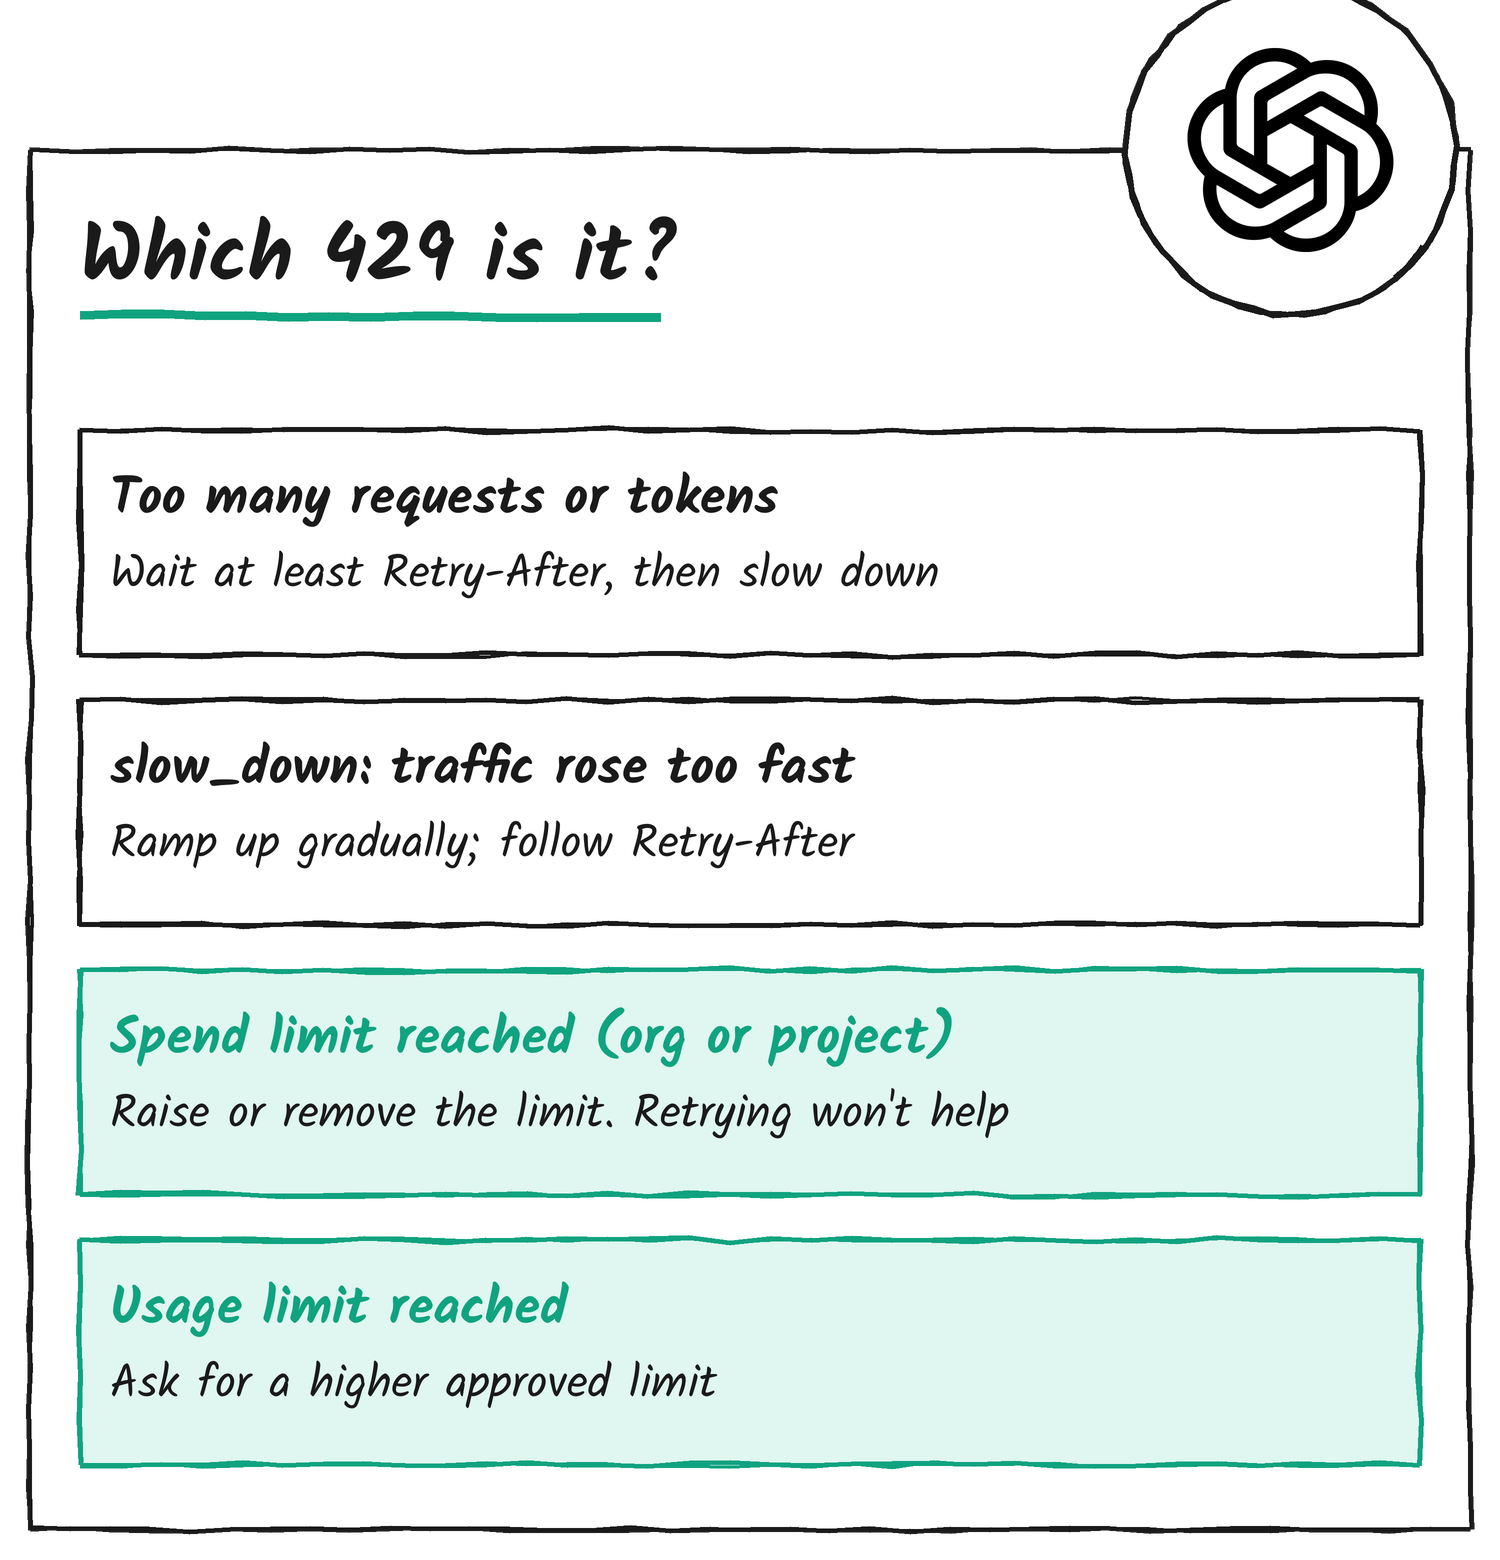
Not every 429 means you sent too much. OpenAI’s error codes guide lists several causes with different fixes. A plain rate-limit 429 needs pacing: wait at least as long as the Retry-After header says, when it’s there. A slow_down code means traffic climbed too fast. Ramp up gradually.
Some 429s are about money. organization_spend_limit_exceeded and project_spend_limit_exceeded mean you’ve reached a hard spend limit, which OpenAI added on 22 July. Retrying won’t get you back in, the guide says. Raise or remove the limit. organization_usage_limit_exceeded is different again: the organisation hit the monthly limit OpenAI assigned it, and you request a higher approved limit or contact support.
Filters, exports and access
OpenAI’s help article covers the controls. Usage filters by API sources, API keys, models, users and processing tier; the API sources filter splits the Agents API from direct API calls. Intervals run from a day down to a minute, and the one-minute view is where you see tokens per minute. Spend has its own filters: API sources, API keys, models and line items.
Export CSV, in the toolbar, downloads activity data. Compare dashboards shows two views side by side for the same period. Everything is in UTC and the data goes back one year. Opening the dashboard takes an organisation owner role or the Usage Dashboard permission.
Analytics lives at platform.openai.com/analytics. Organization analytics covers every project at once.
Disclosure: I’m an OpenAI, Firecrawl and Devin ambassador.
Discover more from Sulat AI & Tech News
Subscribe to get the latest posts sent to your email.