
Adam Holter, who writes about AI on X, shared a chart at 04:33 UTC on 22 November (5:33pm NZDT) with the line “Neon is stealing users from Opus”. The chart counts T3 Code installs that ran Google’s Gemini 4 Neon between 21:00 UTC on 18 November and 02:00 UTC on 21 November.1 T3 Code is the coding app from Theo Browne’s T3 Tools, and it can drive agents such as Claude Code and Google’s Antigravity from one window.
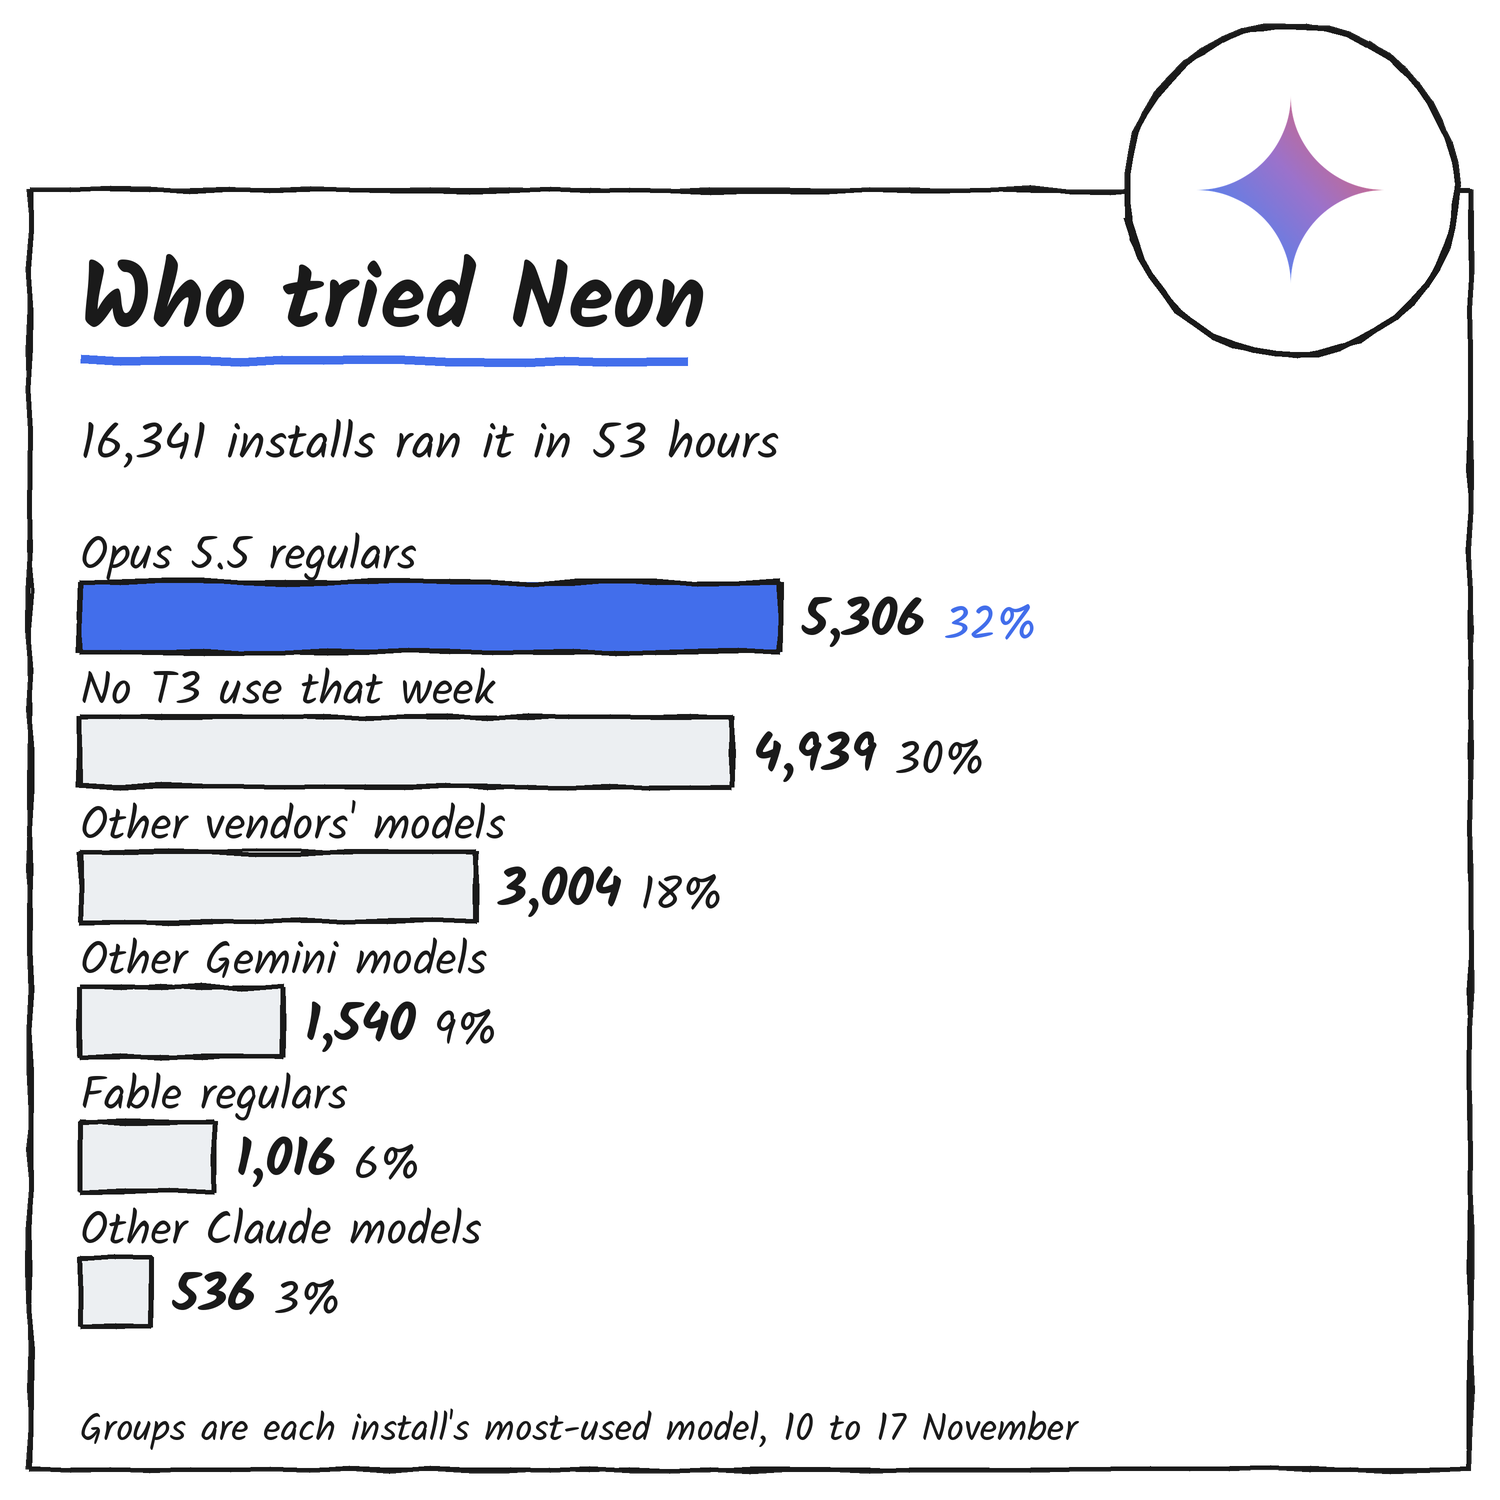
The chart shows 16,341 installs that ran Neon in 53 hours, and the biggest group, 5,306, had Opus 5.5 as its most-used model the week before. Its own footnote puts that at 9% of Opus-led installs, so 91% of them didn’t run Neon. What the chart measures is trial. It doesn’t show Opus turns before or after the launch, so it can’t show anyone leaving Opus.
- What the chart counts
- Who the 16,341 were
- Tried it, or switched?
- What T3’s public usage page shows
- Why installs had a reason to try Neon
- What the chart can’t answer
What the chart counts
The footnote under the chart reads: T3 Code installs that ran Gemini 4 Neon, 18 November 21:00 to 21 November 02:00 UTC (16,341), user turns. Neon is turns that name it plus Antigravity default turns, which the chart calls Neon High. The left side groups each install by the model it ran most from 10 to 17 November, and the right side splits the same installs by whether Neon made up half or more of their turns after the launch.
16,341
installs ran Neon in 53 hours
5,306
were Opus 5.5 regulars
9%
of Opus-led installs ran Neon
6,330
made Neon half or more of their turns
- Install
- One copy of T3 Code reporting telemetry under a hashed identifier.
- Turn
- One request a user sends to a model. The chart counts user turns.
- Most-used model
- The model an install ran most between 10 and 17 November. “No T3 use that week” means the install sent nothing in that period.
- Antigravity
- Google’s coding agent. The chart counts its default turns as Neon turns.
Who the 16,341 were
Opus 5.5 regulars are the largest group, at 32% of everyone who ran Neon. The second largest, 4,939 installs, is the group with no T3 Code use from 10 to 17 November, which covers new installs and returning ones. Together those two groups are 63% of the total. Installs led by a Claude model of any kind add up to 6,858, or 42%.
| Most-used model, 10 to 17 November | Installs that ran Neon | Share of Neon runners | Share of the group that ran Neon |
|---|---|---|---|
| Opus 5.5 | 5,306 | 32% | 9% |
| No T3 use that week | 4,939 | 30% | 17% |
| Other vendors’ models, three groups | 3,004 | 18% | 10% to 11% |
| Other Gemini models | 1,540 | 9% | 63% |
| Fable | 1,016 | 6% | 13% |
| Other Claude models | 536 | 3% | 8% |
| Total | 16,341 | 100% |
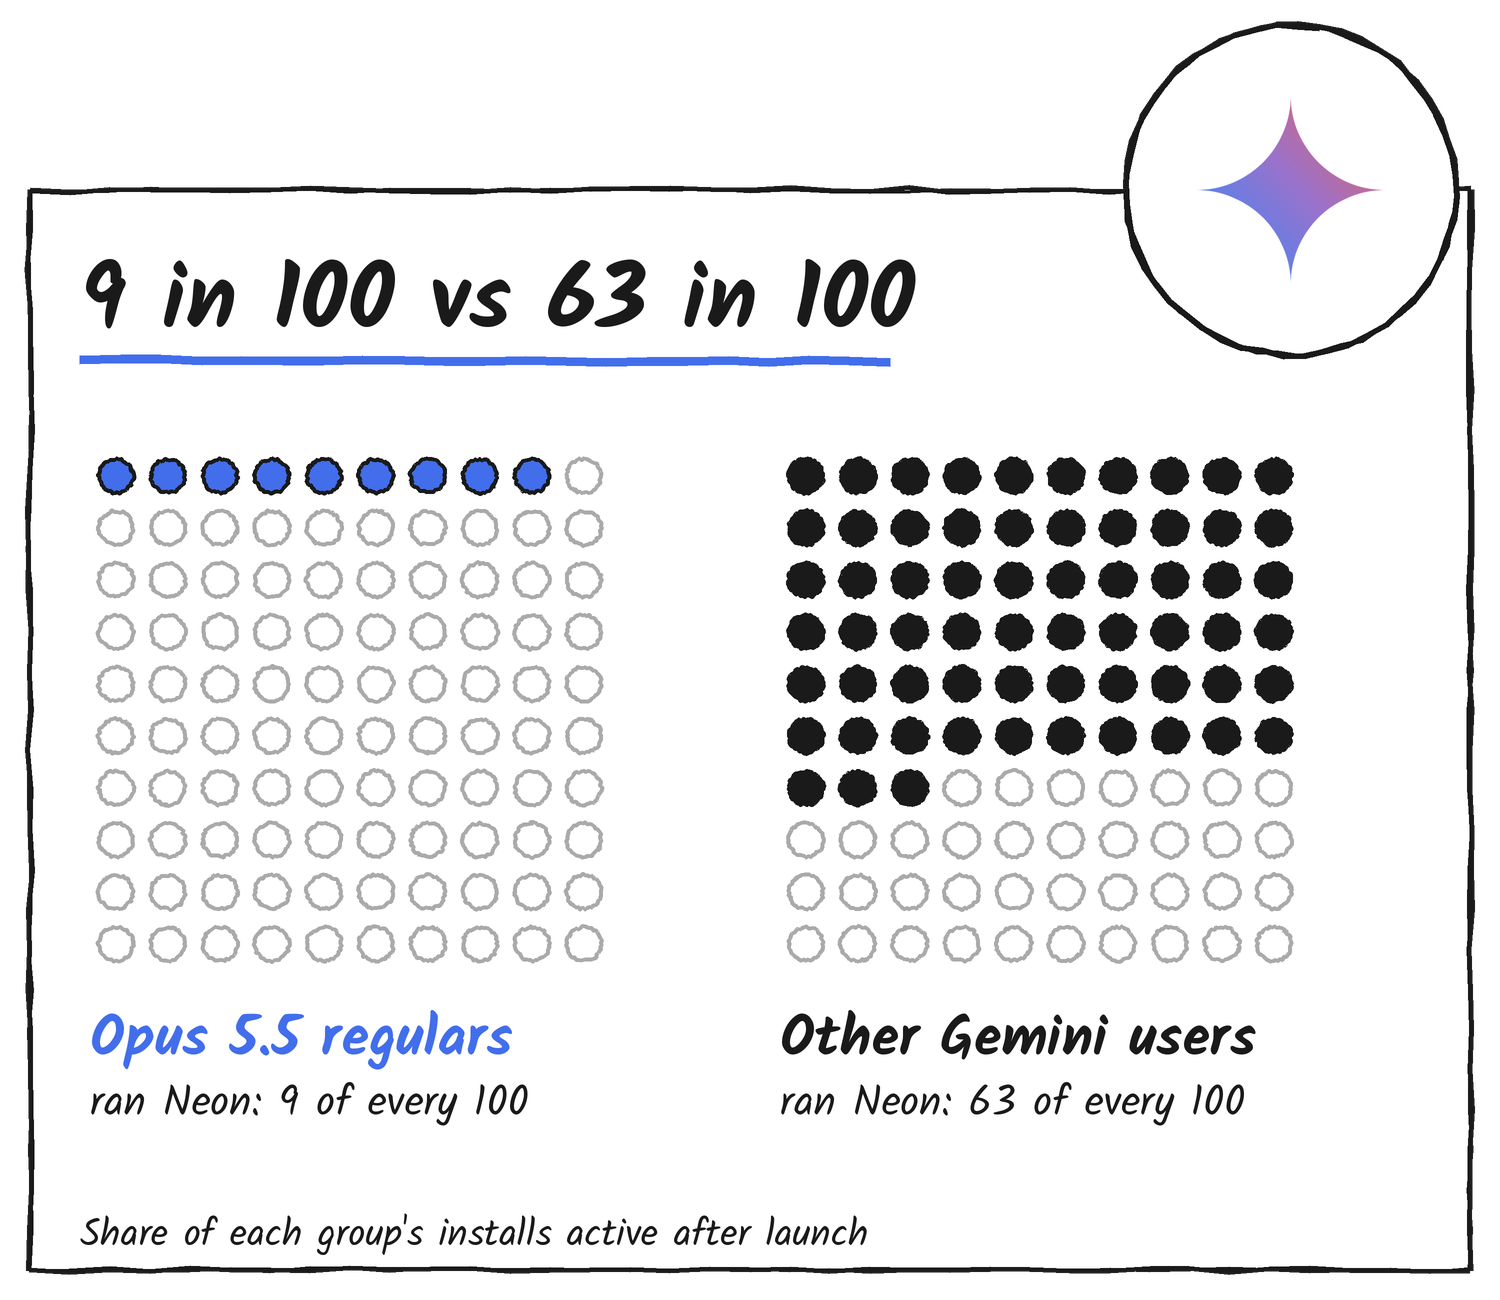
The last column is the number to read first. The footnote defines it as the share of each group’s installs active after launch that ran Neon. For Opus-led installs it’s 9%, for Fable-led installs 13% and for other Claude installs 8%. For installs whose most-used model was another Gemini model it’s 63%.
Tried it, or switched?
Neon is stealing users from Opus
Adam Holter on X, 22 November 2026
The right side of the chart is the closest it gets to that claim. Of the 16,341 installs, 6,330 made Neon half or more of their turns after launch, and 10,011 kept it under half. That’s 39% and 61%. The chart doesn’t label how many of the 6,330 came from the Opus group; the Opus band into the “half or more” node is visibly the smaller of its two flows, but it carries no number.
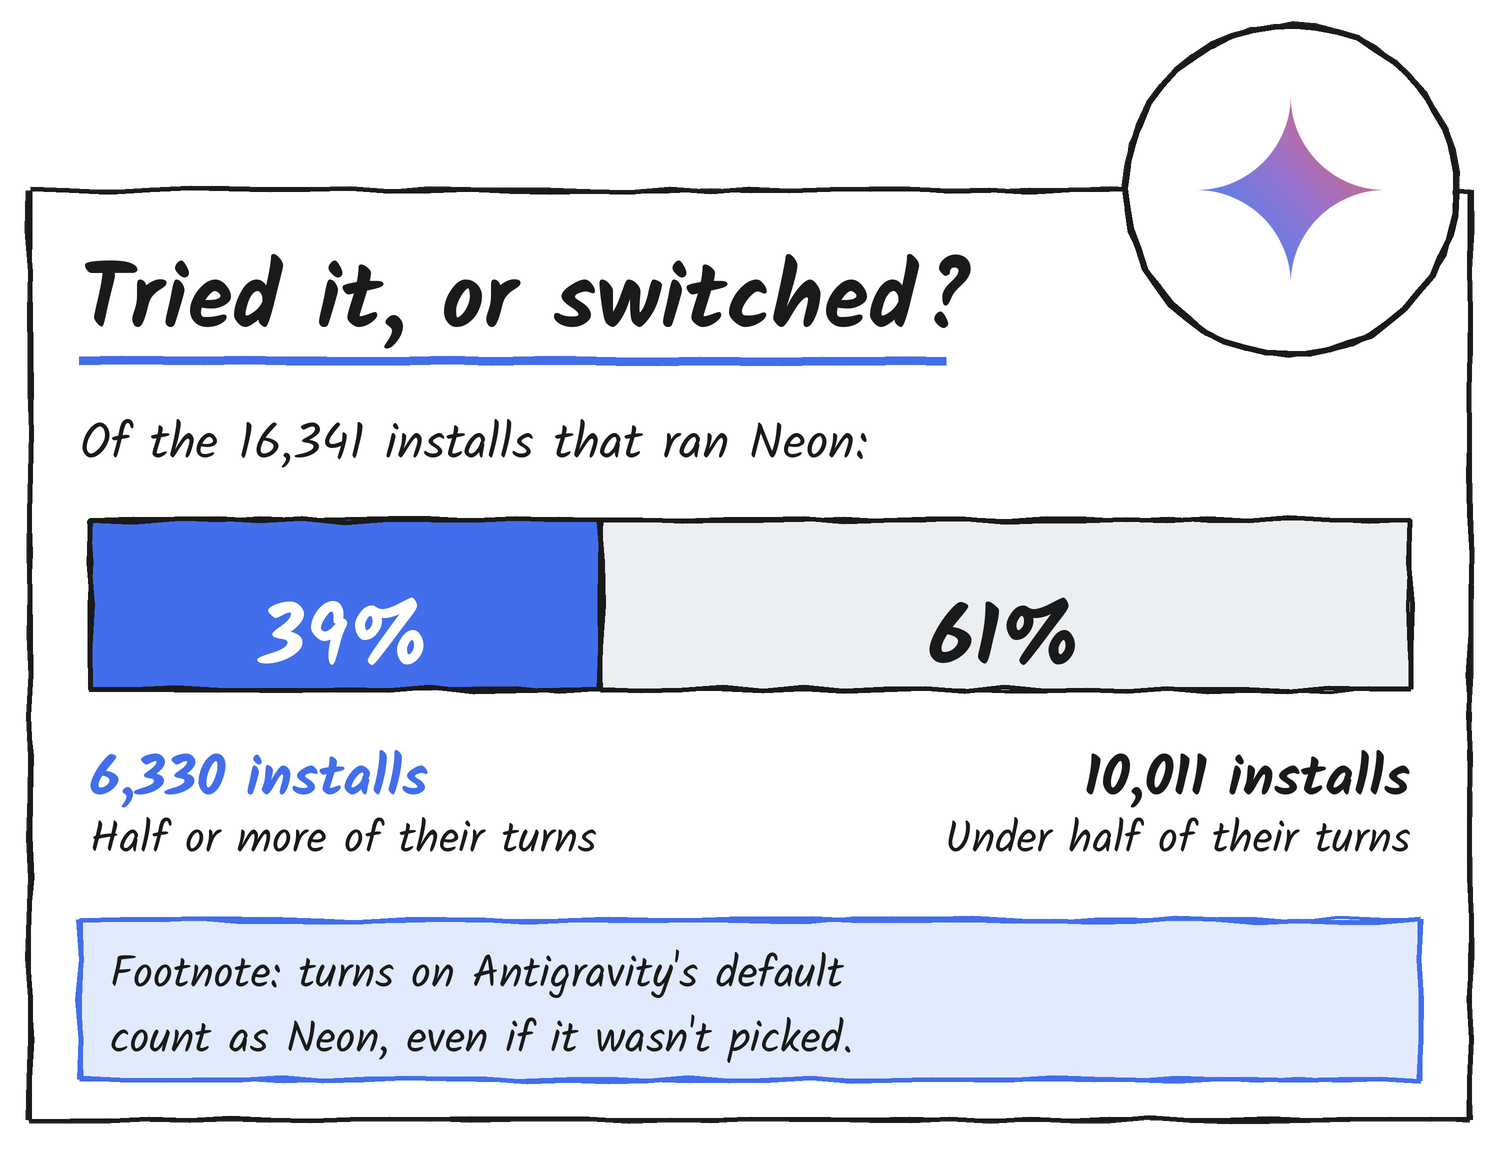
How the chart defines Neon changes what the numbers mean. Because the chart counts Antigravity’s default turns as Neon turns, an install that runs Antigravity on its defaults and never picks a model by name still shows up as a Neon install. The footnote gives no minimum number of Neon turns for an install to count as having run it. That fits the 63% for installs already on Gemini models, which is the largest rate in the chart.
What T3’s public usage page shows
Slopalytics, a site Theo built to chart Artificial Analysis data and usage from T3 Code, publishes daily shares of turns from T3 Code’s release-build telemetry. Its page, updated on 22 November, covers 23 October to 21 November (UTC) and has Opus 5.5 at 61.3% of turns on average, up 2.1 percentage points from the first observed day to the last. Sonnet 5.5 is at 4.3%, Fable 5.2 at 4.0%, “Unreported” at 4.2% and “Other” at 2.1%. Neon isn’t broken out in those summary rows.
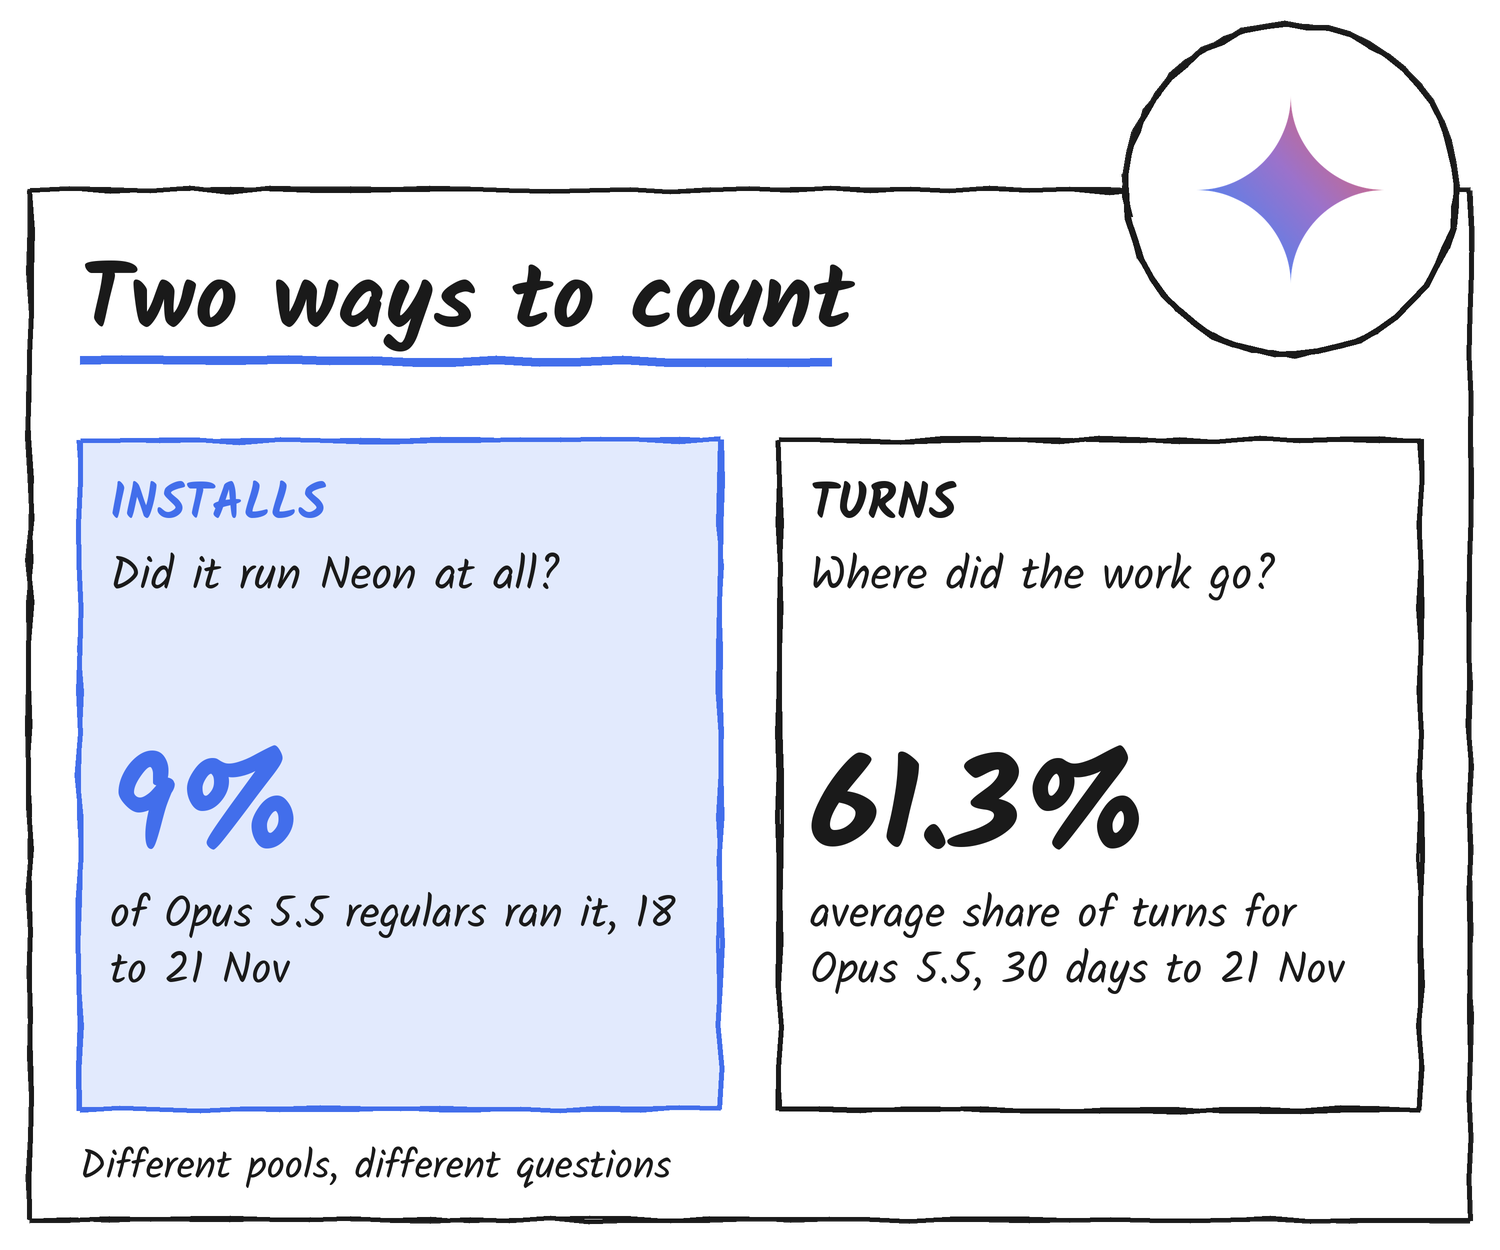
The two sources answer different questions over different windows, so they don’t contradict each other. They also can’t be joined. Slopalytics says it publishes only shares, that “volumes are not available”, and that observed shares aren’t market-wide shares. Adam Holter’s chart has install counts, so those figures don’t come from Slopalytics’ public pages. His post doesn’t say where they do come from, and I haven’t been able to reproduce them from any public page.
Usage does not measure model quality. Defaults, subscriptions, and task mix affect usage.
Slopalytics, methodology note on its usage page
What T3 Code’s telemetry records
T3 Code’s product usage data page says the server sends events to T3’s own endpoint, tied to a hashed account or installation identifier, with the provider, model, reasoning effort, permission mode, turn result and duration. Installs that opt out with T3CODE_TELEMETRY_ENABLED=false aren’t counted at all, so every figure here covers telemetry-reporting installs only.
Product events do not include prompts, responses, file contents, authentication tokens, conversation IDs, raw provider events, or child-agent output.
T3 Code documentation, Product usage data
Why installs had a reason to try Neon
Google released Neon on 18 November at US$3 per million input tokens and US$15 per million output tokens, and its model card lists Google Antigravity as a channel for paid AI Pro and Ultra subscribers. Theo answered a user who asked how to reach the model with “Subs through Antigravity”, so an install on a Google AI plan could reach Neon through its subscription. In my launch article, Artificial Analysis put Neon’s average cost per task in Antigravity at US$6.86, against US$12.61 for Opus 5.5 at max.

Theo, who runs T3 Code and launched Slopalytics, called Neon “an incredible model” in a video on 20 November, and Google replied to the post.
What the chart can’t answer
The chart’s window is 53 hours long. It shows that 16,341 installs ran Neon in that time and that 6,330 of them leaned on it for half or more of their turns. Three things would settle the “stealing” claim, and none of them is in the post:
- Opus 5.5 turns for the same installs before and after 18 November.
- How many of the 6,330 were Opus-led, and how many were Antigravity users on defaults.
- The same split a week later, once the launch spike has passed.
Check the arithmetic yourself
Left side:  5,306 + 4,939 + 1,544 + 1,540 + 1,016 + 784 + 676 + 536 = 16,341
Other vendors' models:  1,544 + 784 + 676 = 3,004
Claude-led:  5,306 + 1,016 + 536 = 6,858  (42% of 16,341)
Right side:  6,330 + 10,011 = 16,341
Half or more of turns: 6,330 / 16,341 = 38.7%- In NZ time, the window runs from 10:00am NZDT on 19 November to 3:00pm NZDT on 21 November. ↩︎
- The counts, the 9%, 63%, 17%, 13% and 8% figures and the two totals are read off the chart. The shares of all Neon runners in the table are my arithmetic from its counts. ↩︎
Sources
- Adam Holter, post and chart on X, 22 November 2026
- Slopalytics, usage page, updated 22 November 2026
- T3 Code documentation, Product usage data
- Google DeepMind, Gemini 4 Neon model card, 18 November 2026
- Theo on X, “Subs through Antigravity”, 19 November 2026
- Theo on X, video post, 20 November 2026
Discover more from Sulat AI & Tech News
Subscribe to get the latest posts sent to your email.