

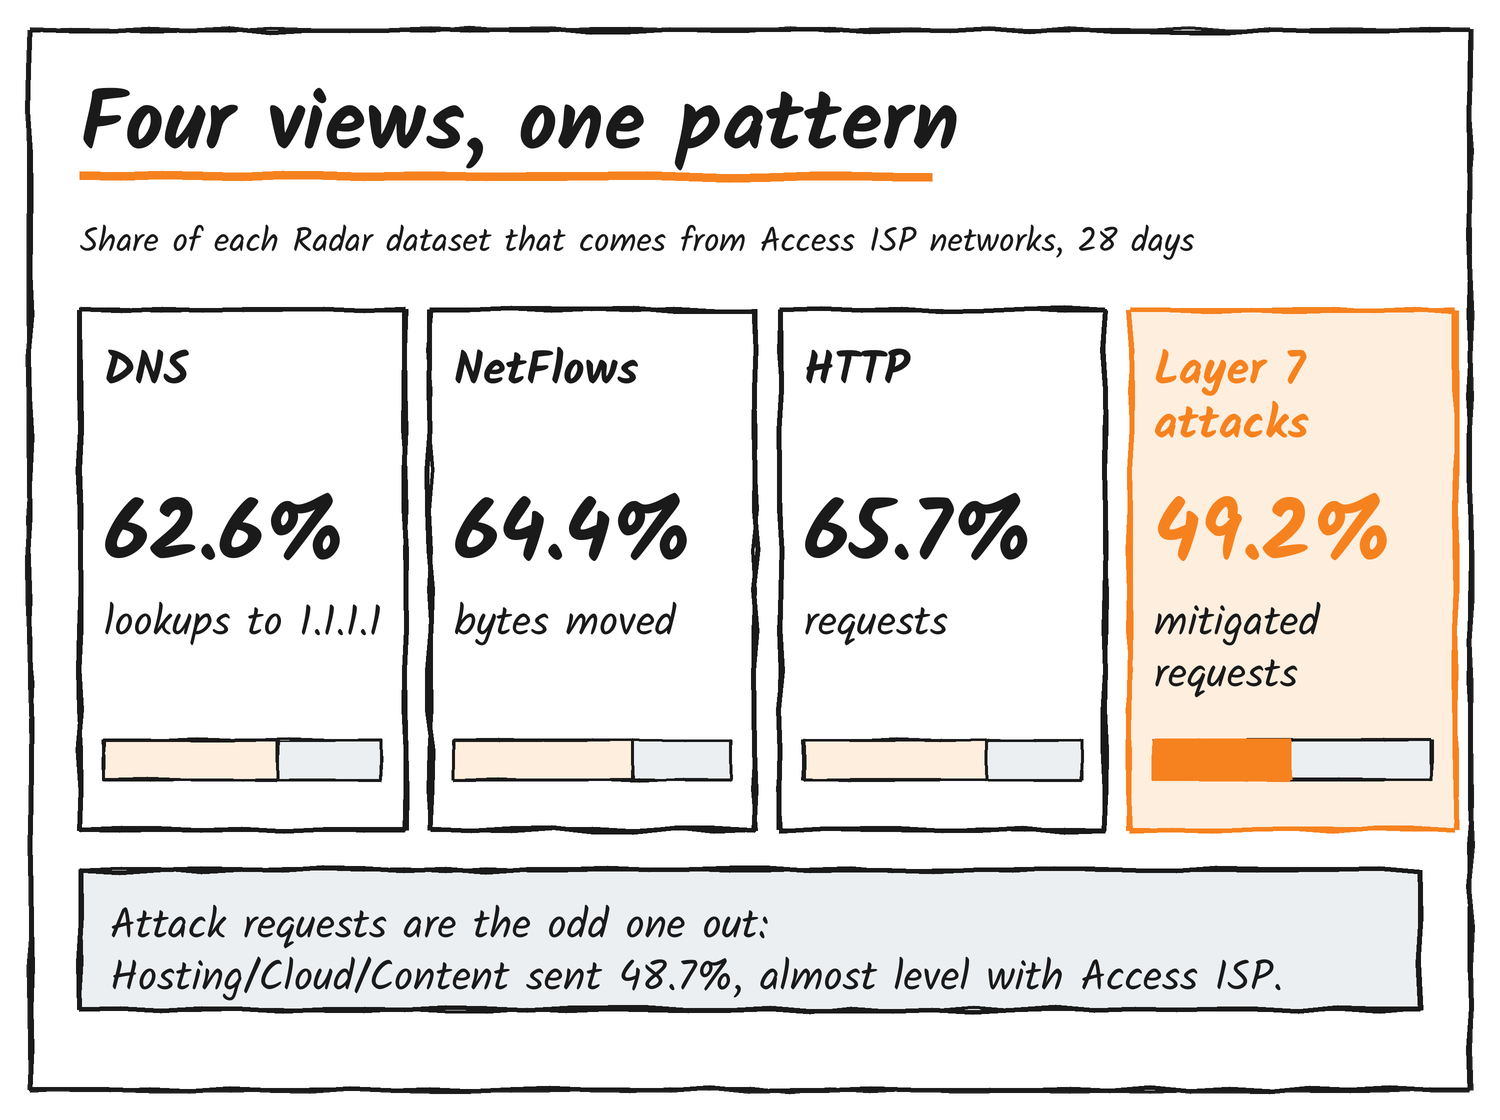
Cloudflare Radar now tags every autonomous system with a type, and the tags make a lot of its data readable in a new way. I queried Radar’s API for the 28 days ending 22 November to see what the split shows.1 Networks Radar calls Access ISPs, the ones that connect homes and phones, sent 65.7% of requests. But they sent 89.8% of the human ones and only 28.0% of the automated ones. Data centres carried most of the bots. The mix also swings hard by country, from 98.4% Access ISP in Nigeria to 11.5% in Singapore.
Cloudflare announced the types on 19 November. I covered the change itself in a news piece. This one is about what the data says, where the labels break, and how to pull the same numbers yourself.
65.7%
of requests come from Access ISPs
89.8%
of human requests do
70.1%
of automated requests come from hosting and cloud
11.5%
of Singapore’s requests come from Access ISPs
The three types, in Cloudflare’s words
An autonomous system, or AS, is a network with its own routing policy, such as an ISP, a cloud provider or a university. Radar’s glossary sorts them like this:
- Access ISP: networks that connect end users to the Internet, such as home broadband and mobile operators, plus transit providers.
- Hosting/Cloud/Content: hosting providers, cloud platforms and content delivery networks.
- Organization: enterprises, universities, governments, banks and IXP route servers.
- Unclassified: an AS with no type. When you filter or group by type, this bucket also holds traffic Radar couldn’t map to an AS.
AS types are inferred automatically, so an individual AS can be misclassified.
Cloudflare Radar changelog, 19 November 2026
People take one road, bots take another
Split the same 28 days by who’s asking and the picture flips. Requests Radar classes as likely human came overwhelmingly from Access ISP networks. Likely automated requests came mostly from Hosting/Cloud/Content networks. Automated traffic was 39.0% of all requests worldwide.
| AS type | All requests | Human requests | Automated requests | Mitigated attack requests |
|---|---|---|---|---|
| Access ISP | 65.7% | 89.8% | 28.0% | 49.2% |
| Hosting/Cloud/Content | 32.8% | 8.9% | 70.1% | 48.7% |
| Organization | 1.4% | 1.2% | 1.6% | 1.1% |
| Unclassified | 0.2% | 0.1% | 0.3% | 1.0% |
Attacks are the odd one out. Mitigated layer 7 requests came almost evenly from the two big types, with Hosting/Cloud/Content at 48.7% and Access ISP at 49.2%. Radar’s list of top attack-origin networks is led by Google’s AS396982 at 7.3% of mitigated requests, then China’s CHINANET backbone at 2.9%, Amazon at 2.7% and Microsoft at 2.5%.
Every country has its own mix
The world figure hides wide swings. In Nigeria, Access ISP networks sent 98.4% of requests, and in the Philippines 97.1%. In the US they sent 44.0%, and Hosting/Cloud/Content sent 54.2%. Germany is close to even, at 46.3% and 52.0%. Singapore is the extreme: 87.6% from Hosting/Cloud/Content and 11.5% from Access ISPs.
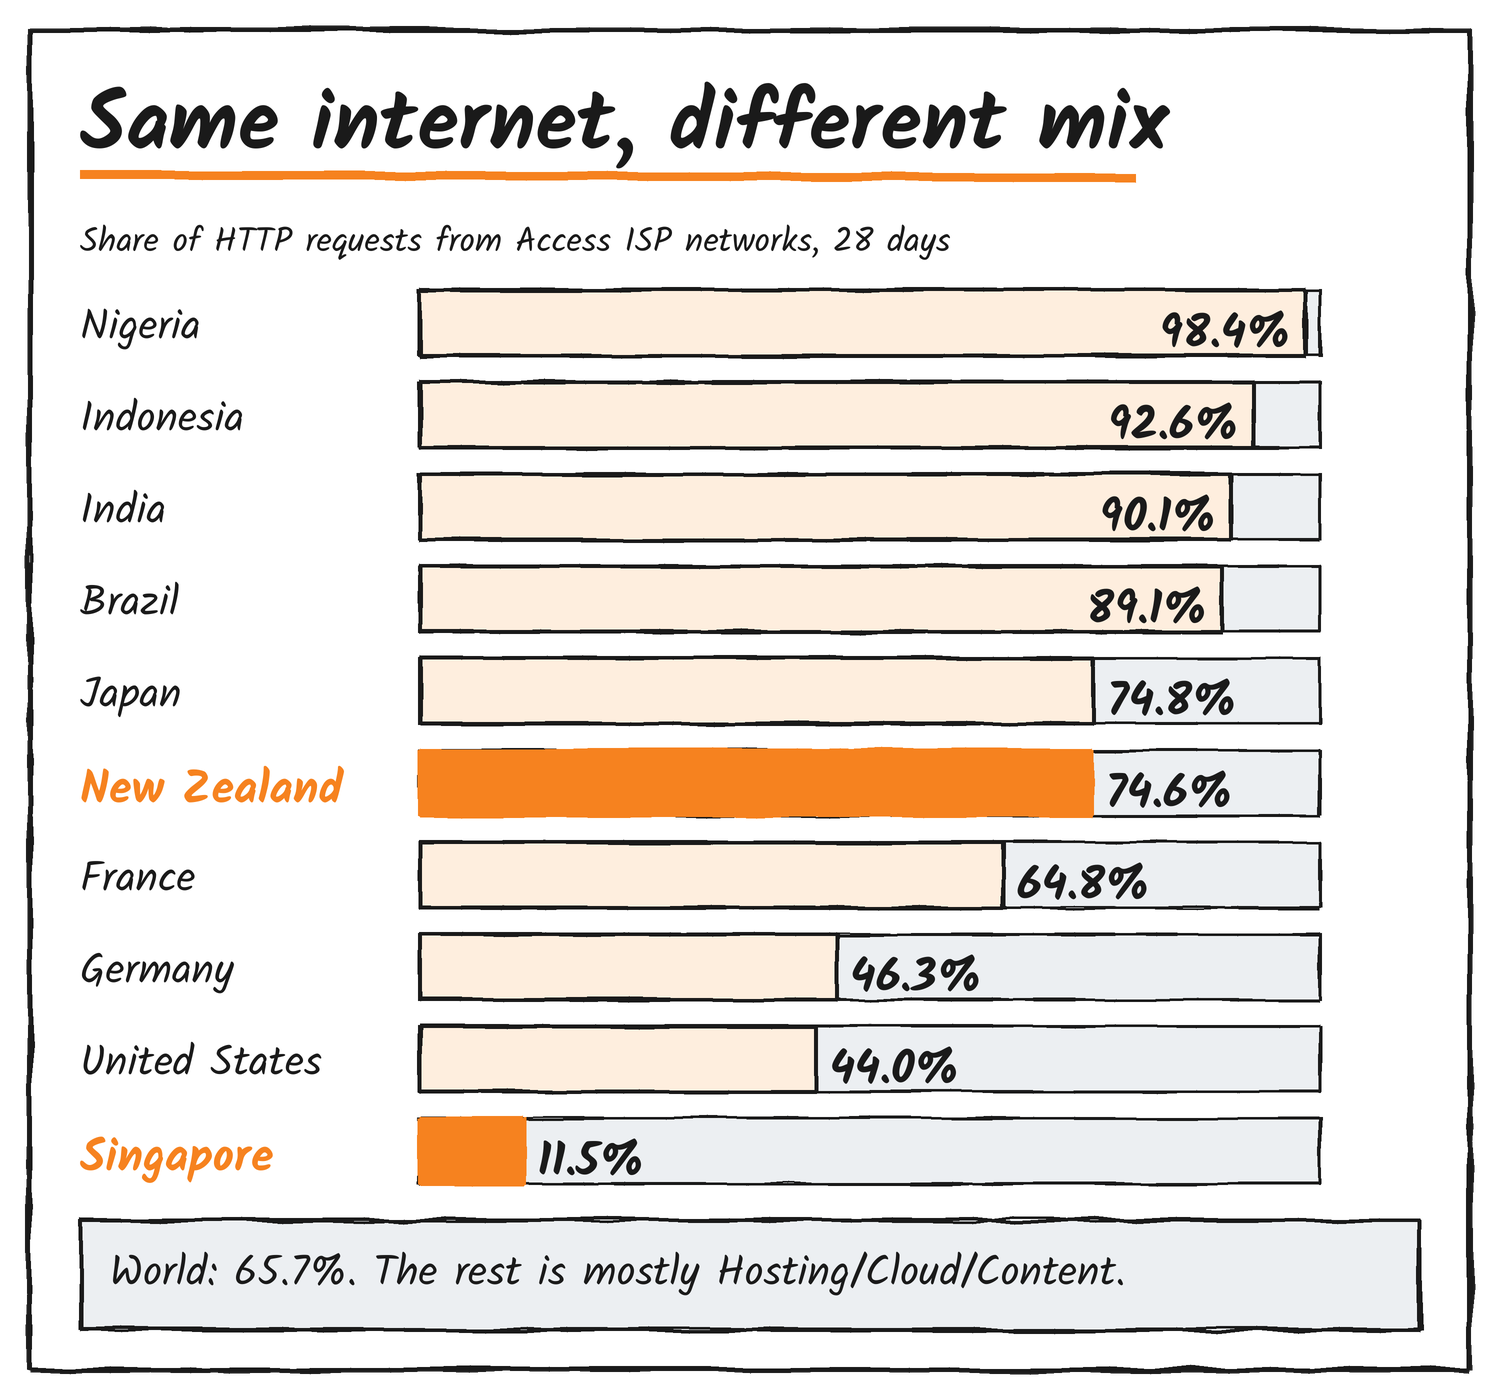
Radar’s top-network lists show what sits behind the numbers. Singapore’s five biggest networks by requests are Alibaba (16.4%), Amazon (14.1%), Tencent (8.5%), Google (6.4%) and DigitalOcean (3.6%). Automated traffic made up 81.0% of Singapore’s requests, against 39.0% worldwide. Germany’s list mixes the two worlds: Deutsche Telekom (17.5%), Hetzner (13.6%), Vodafone (11.1%) and Amazon (7.9%).
New Zealand sits at 74.6% Access ISP, 21.7% Hosting/Cloud/Content and 3.7% Organization. The top four networks are Spark (17.7%), 2degrees (16.8%), One NZ (13.2%) and Microsoft (11.3%). Radar types the first three as Access ISPs and Microsoft’s AS8075 as Hosting/Cloud/Content. Automated traffic is 30.3% of New Zealand’s requests.
New Zealand’s bots look different
New Zealand’s human traffic looks like everyone else’s: 90.2% of likely human requests came from Access ISPs, against 89.8% worldwide. The automated side doesn’t match. Hosting/Cloud/Content networks sent 52.8% of New Zealand’s automated requests, against 70.1% worldwide, and Access ISPs sent 38.7%, against 28.0%. Organization networks sent 8.4%, against 1.6%.
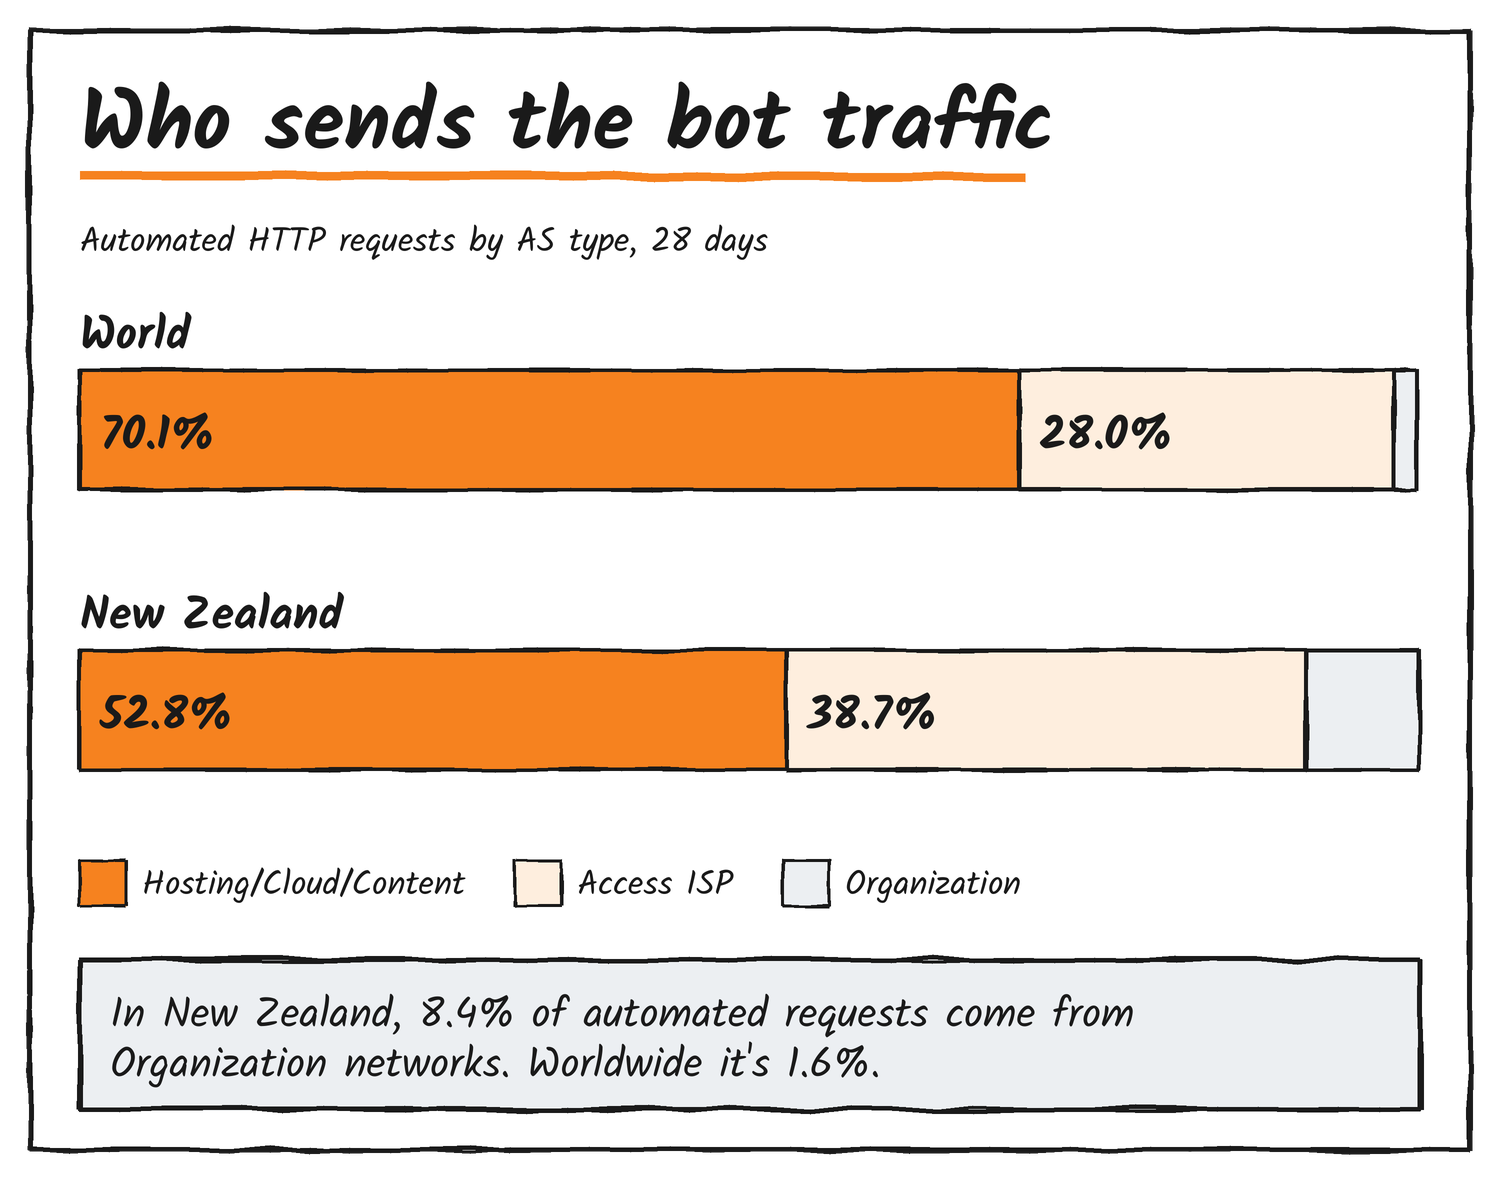
Radar doesn’t say why. What the numbers do show is that “automated” isn’t a synonym for “data centre”. More than a quarter of the world’s automated requests, and nearly 39% of New Zealand’s, came from networks Radar calls Access ISPs.
Where the labels look off
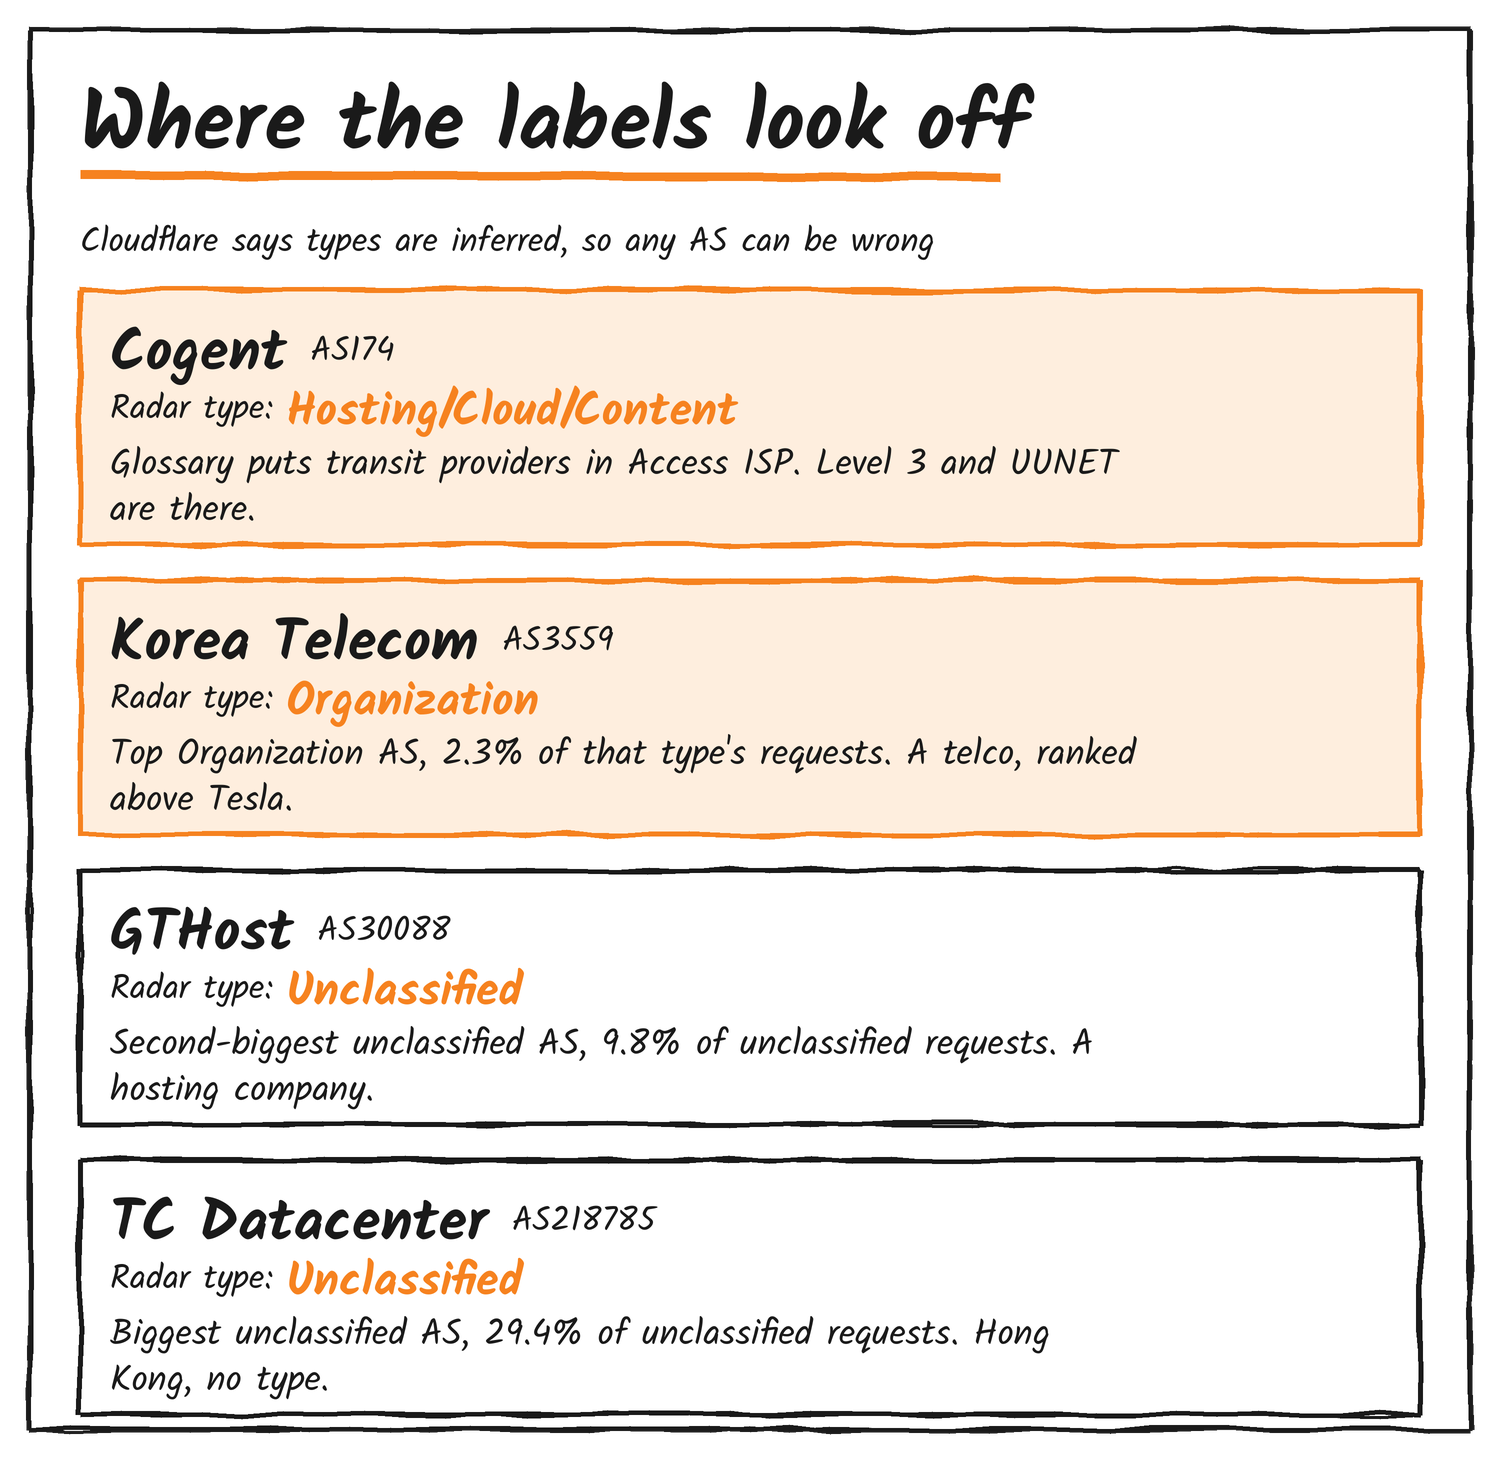
Cloudflare warns that types are inferred, and the API shows what that means in practice. The glossary puts transit providers under Access ISP, and Level 3 (AS3356) and UUNET (AS701) are there. Cogent (AS174), one of the biggest transit networks, is typed Hosting/Cloud/Content. Korea Telecom’s KORNET (AS3559) is typed Organization, and it’s the biggest Organization network by requests, ahead of Adjust, Tesla and Arista Networks.
The Unclassified bucket is small, at 0.2% of requests, but its biggest members are hosting companies. TC Datacenter (AS218785, Hong Kong) accounts for 29.4% of unclassified requests and GTHost (AS30088) for 9.8%. Cloudflare takes corrections at [email protected].
How have networks been classified before?
Neither the changelog nor the glossary says how Radar infers its types. Two earlier efforts show how hard the job is. CAIDA’s AS classification dataset sorted networks into Transit/Access, Content and Enterprise with a decision-tree classifier trained on PeeringDB labels. CAIDA’s page reports a 70% positive predictive value and says the dataset is no longer supported. Stanford’s ASdb combines business databases, website classifiers and machine learning. Its authors report 93% accuracy on 17 industry categories and 75% on 95 sub-categories.
Pull the numbers yourself
The Data Explorer can break down and filter HTTP, NetFlows, DNS and layer 7 attack data by AS type. In the API, three endpoints return a new category field (Get AS details, List ASes and Get AS details by IP address), and the HTTP, NetFlows, DNS and layer 7 endpoints take an asCategory filter and an AS_CATEGORY grouping. These are the calls behind the figures above, with an API token in $CLOUDFLARE_API_TOKEN:
# share of HTTP requests by AS type, worldwide
curl "https://api.cloudflare.com/client/v4/radar/http/summary/AS_CATEGORY?dateRange=28d" \
  --header "Authorization: Bearer $CLOUDFLARE_API_TOKEN"

# the same, for likely human or likely automated requests only
curl ".../radar/http/summary/AS_CATEGORY?dateRange=28d&botClass=LIKELY_HUMAN"
curl ".../radar/http/summary/AS_CATEGORY?dateRange=28d&botClass=LIKELY_AUTOMATED"

# one country (New Zealand), and attack requests by source type
curl ".../radar/http/summary/AS_CATEGORY?dateRange=28d&location=NZ"
curl ".../radar/attacks/layer7/summary/AS_CATEGORY?dateRange=28d"

# top networks within one type
curl ".../radar/http/top/ases?dateRange=28d&limit=8&asCategory=HOSTING_CLOUD_CONTENT"

# one network's type
curl ".../radar/entities/asns/174"
For HTTP, the type filter and grouping work for date ranges starting on or after 1 May 2023.
What the types can and can’t tell you
- Good for: telling residential and mobile traffic from data-centre traffic in aggregate, comparing countries, and checking whether attack or bot traffic is coming from cloud ranges.
- Not good for: deciding that a request is human because its network is an ISP. Access ISPs sent 28.0% of automated requests worldwide.
- Per network, not per company: a type belongs to one AS. Amazon’s AS16509 and Google’s AS396982 are typed Hosting/Cloud/Content, but a company with several ASes can have several types.
- Unmapped traffic counts as Unclassified: the bucket mixes unlabelled networks with requests Radar couldn’t tie to any AS.
- ASN
- Autonomous System Number, the ID a network uses in BGP routing. Cloudflare’s is AS13335.
- Transit provider
- A network that carries other networks’ traffic across the Internet. Radar files these under Access ISP.
- IXP
- Internet exchange point, where networks swap traffic. Radar files IXP route servers under Organization.
- Layer 7 attack
- An attack at the application layer, such as a flood of HTTP requests. Radar’s figures are for requests Cloudflare mitigated.

- Radar’s traffic figures describe what reaches Cloudflare’s network, and its DNS figures come from lookups to Cloudflare’s 1.1.1.1 resolver. They aren’t a census of the whole Internet. ↩︎
- The 28-day window ran from 25 October to 22 November 2026 (UTC), with data last updated on 22 November. Shares are percentages of requests unless a line says bytes or lookups. ↩︎
Discover more from Sulat AI & Tech News
Subscribe to get the latest posts sent to your email.