

Young people are finding it harder to get into work in the US, China and much of Europe, according to the International Labour Organization, the New York Fed, Stanford researchers and China’s National Bureau of Statistics. The four sources don’t measure the same thing, though, and a fifth number that travels with them, the share of young Italians and Spaniards living at home, tells a different story from the job figures.
I went to the primary data behind each claim. Here’s what each dataset says, who it counts and where its limits are.
The global baseline: 67 million jobless young people
The ILO’s Global Employment Trends for Youth 2026 says the global unemployment rate for people aged 15 to 24 rose to 12.4 per cent in 2025, which is 67 million people. That’s 2 million more than in 2023, when the rate hit its lowest level this century at 12.3 per cent.
The ILO also counts young people who are neither working nor studying nor training, the NEET group. That share rose from 19.7 per cent in 2023 to 20 per cent in 2025, adding 9 million people to reach 257 million. The ILO says NEET youth are harder to bring back into work or school than unemployed youth, because they’ve stepped outside the labour market altogether.
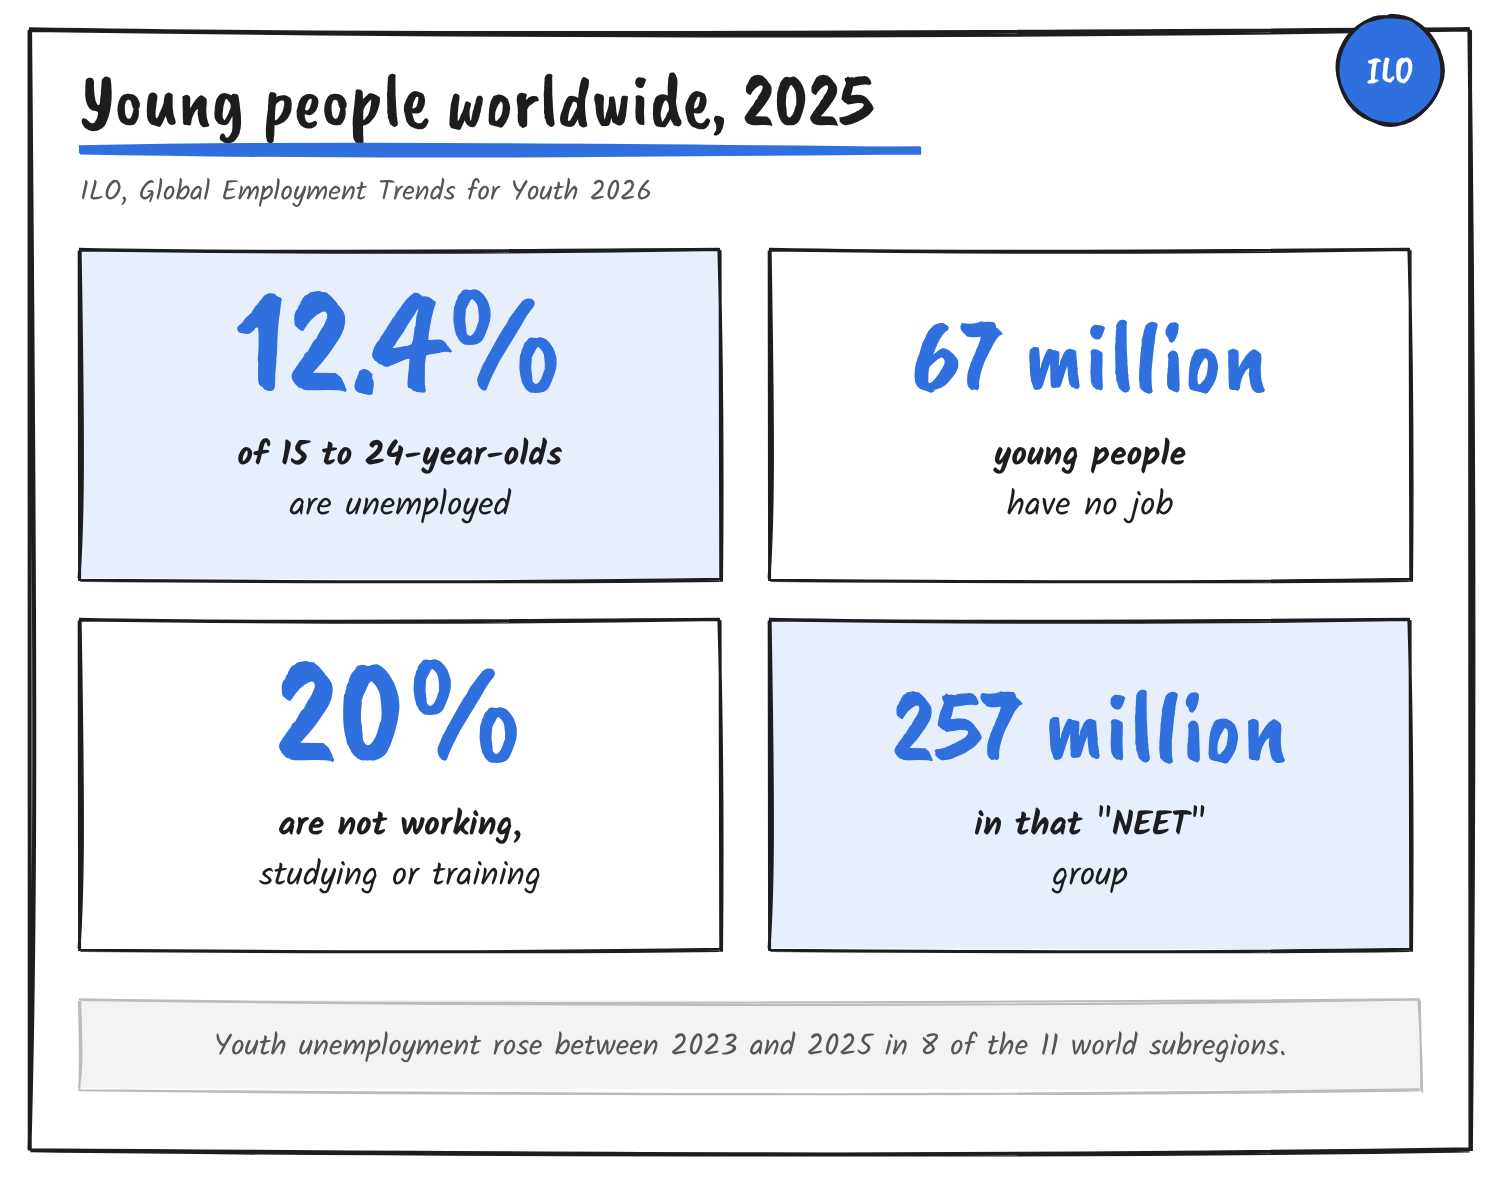
The rise is broad. Youth unemployment went up between 2023 and 2025 in eight of the 11 world subregions, and in 105 countries against 58 where it fell. The biggest increases were in Northern Africa and Northern America. The ILO says the cause is a mix of slower growth, weak job creation, geopolitical tension and technological change, and it estimates that 6.1 per cent of jobs held by 15 to 29-year-olds sit in occupations highly exposed to AI.
US graduates now sit above the national rate
The New York Fed tracks unemployment for recent graduates, defined as people aged 22 to 27 with a bachelor’s degree or higher who aren’t enrolled in school. The Richmond Fed’s 10 November Macro Minute says that before 2018 this group had lower unemployment than the country as a whole. That reversed, and the Richmond Fed says it happened before COVID or AI arrived.
As of September, recent graduates had a 5.2 per cent unemployment rate, which the Richmond Fed puts about a percentage point above the rate for all workers. In the New York Fed’s own series, all workers aged 16 to 65 who aren’t enrolled in school were at 4.0 per cent, according to DataHub’s reading of the 2 November release. The 5.2 per cent is the lowest in a year and has improved since late 2025.
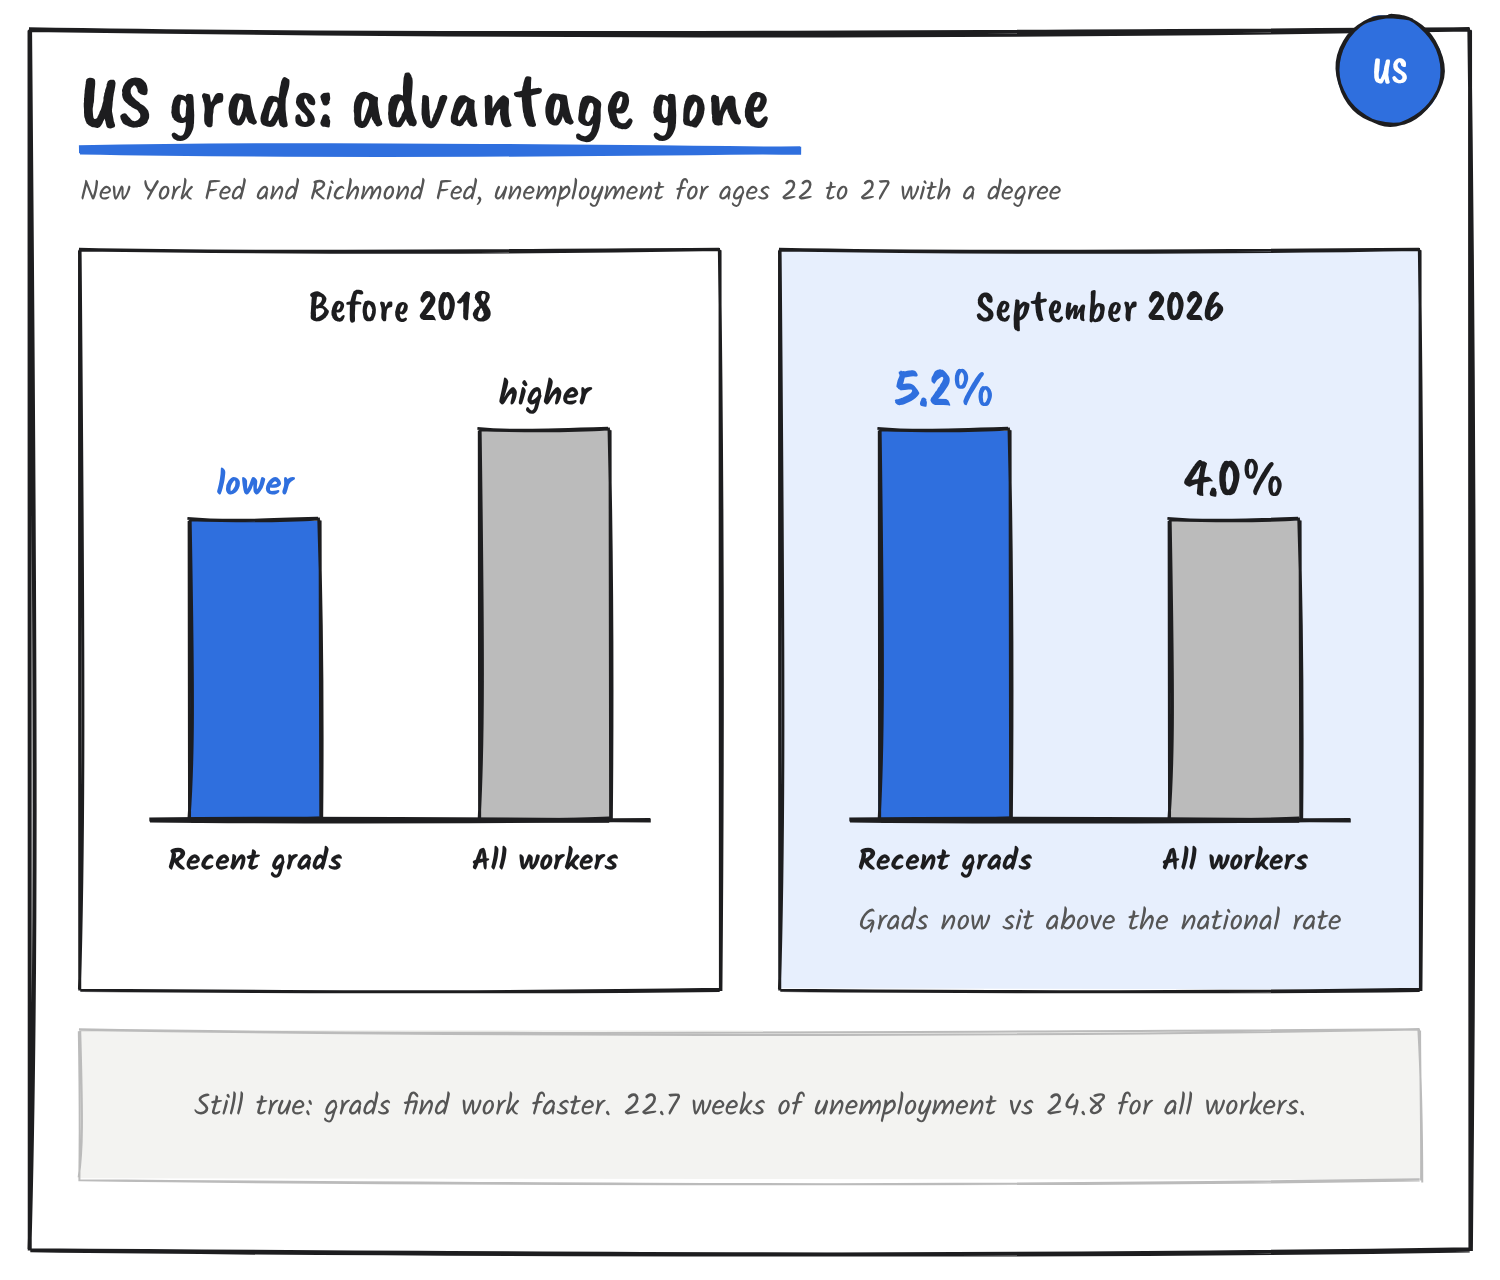
Graduates still hold one advantage. The 12-month average for how long a recent graduate stays unemployed was 22.7 weeks in September, against 24.8 weeks for the national average. The Richmond Fed adds that the gap between white and non-white graduates is widening: 26.8 weeks against 19.9.
The degree matters. DataHub cites New York Fed figures showing that recent computer science graduates had a 7.0 per cent unemployment rate in 2024, against 4.2 per cent for all recent graduates.
Software is where the AI argument lands
The sharpest claim about AI and young workers comes from Erik Brynjolfsson, Bharat Chandar and Ruyu Chen at Stanford’s Digital Economy Lab. Their August 2026 update uses payroll records from ADP, the largest US payroll provider, covering millions of workers through June 2026.
They report no widespread, economy-wide job displacement tied to AI. They do find that employment of 22 to 25-year-olds in highly AI-exposed occupations stands about 19 per cent below where it would be had it tracked similarly aged workers in less-exposed jobs. The shortfall was 15 per cent at the July 2025 data vintage. Experienced workers show no comparable gap, and the authors say the adjustment runs mainly through reduced hiring of young workers, not more separations.
In levels, employment of 22 to 25-year-olds in the two most exposed quintiles fell about 11 per cent between November 2022 and June 2026. The same age group in the three least-exposed quintiles grew about 10 per cent. The pattern is concentrated where AI use mostly automates tasks, and employment is flat or rising where AI mostly complements workers.
Software developers are the clearest case. DataHub’s analysis of the Stanford index, with data to October 2026, puts US developers aged 22 to 25 at 81.4 against 100 in November 2022, close to the group’s peak. Developers aged 26 to 30 are down 4 per cent, every group over 30 grew, and ages 41 to 49 sit at 120.2. DataHub also cites Indeed economists who found that 71 per cent of the increase in software job postings between May 2025 and May 2026 was for senior roles, and that entry-level roles were 4.5 per cent of software postings in early 2026.
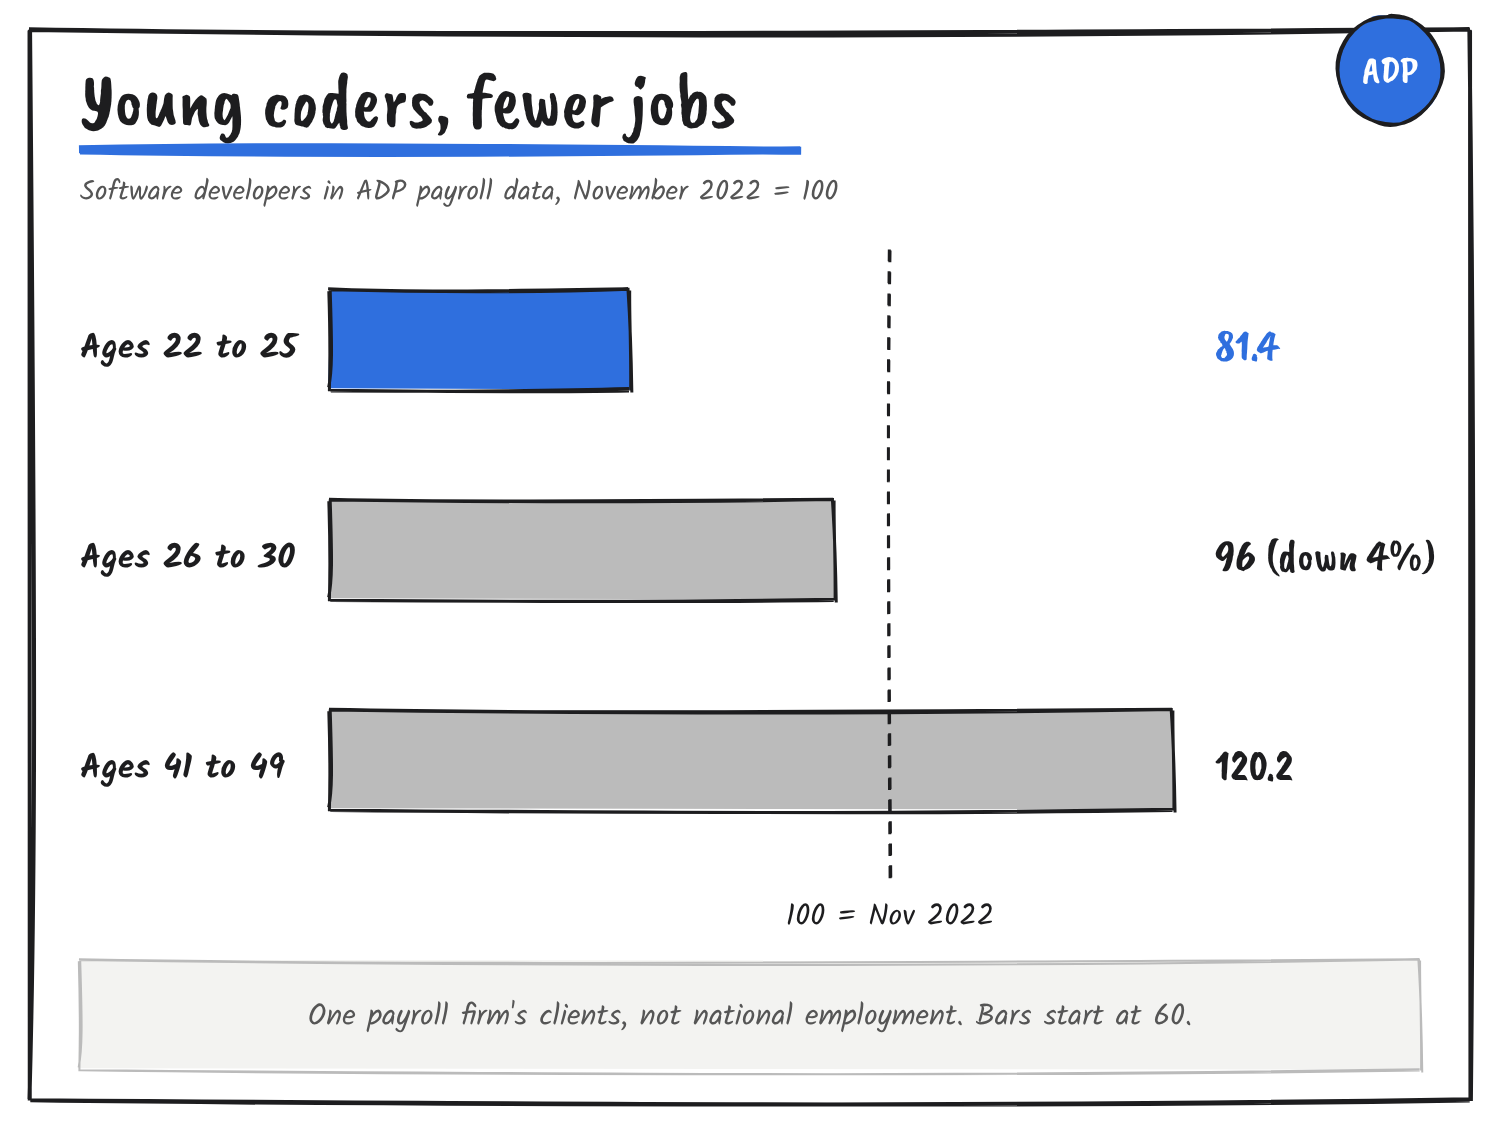
The Stanford authors call their results “early, descriptive indicators”, not causal estimates. They say the pattern fades when they control for education, that some of the divergence predates generative AI, and that it’s more pronounced in the ADP sample than in national survey benchmarks. On the Stanford dashboard, the declines in AI-exposed jobs only turn statistically significant in 2024 with the broadest controls, and the earlier declines are likely driven by non-AI factors. The data comes from one payroll company’s clients, not the whole US economy.
Italy and Spain: a stable habit, not a new crisis
Eurostat’s 15 September release says young people in the EU left their parents’ home at an average age of 26.3 in 2025. Spain and Italy were both at 30.2. Croatia was at 31.5, and Finland at 21.3 was lowest, with Denmark at 21.8.
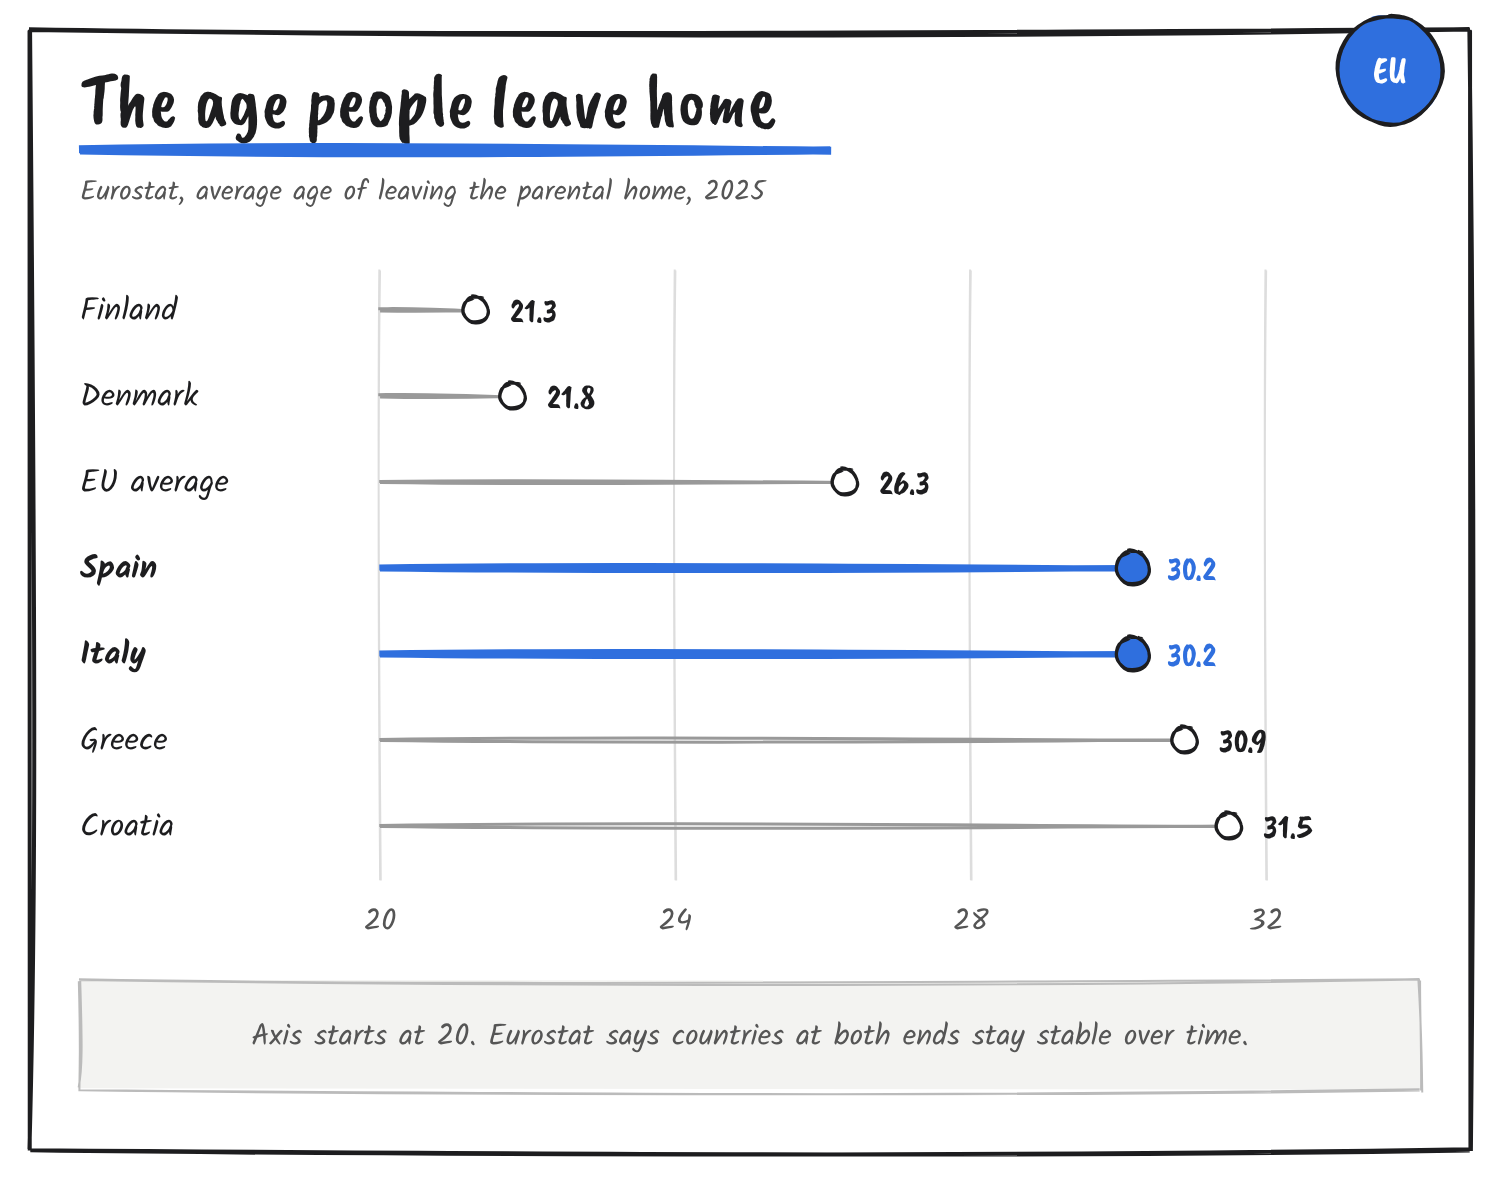
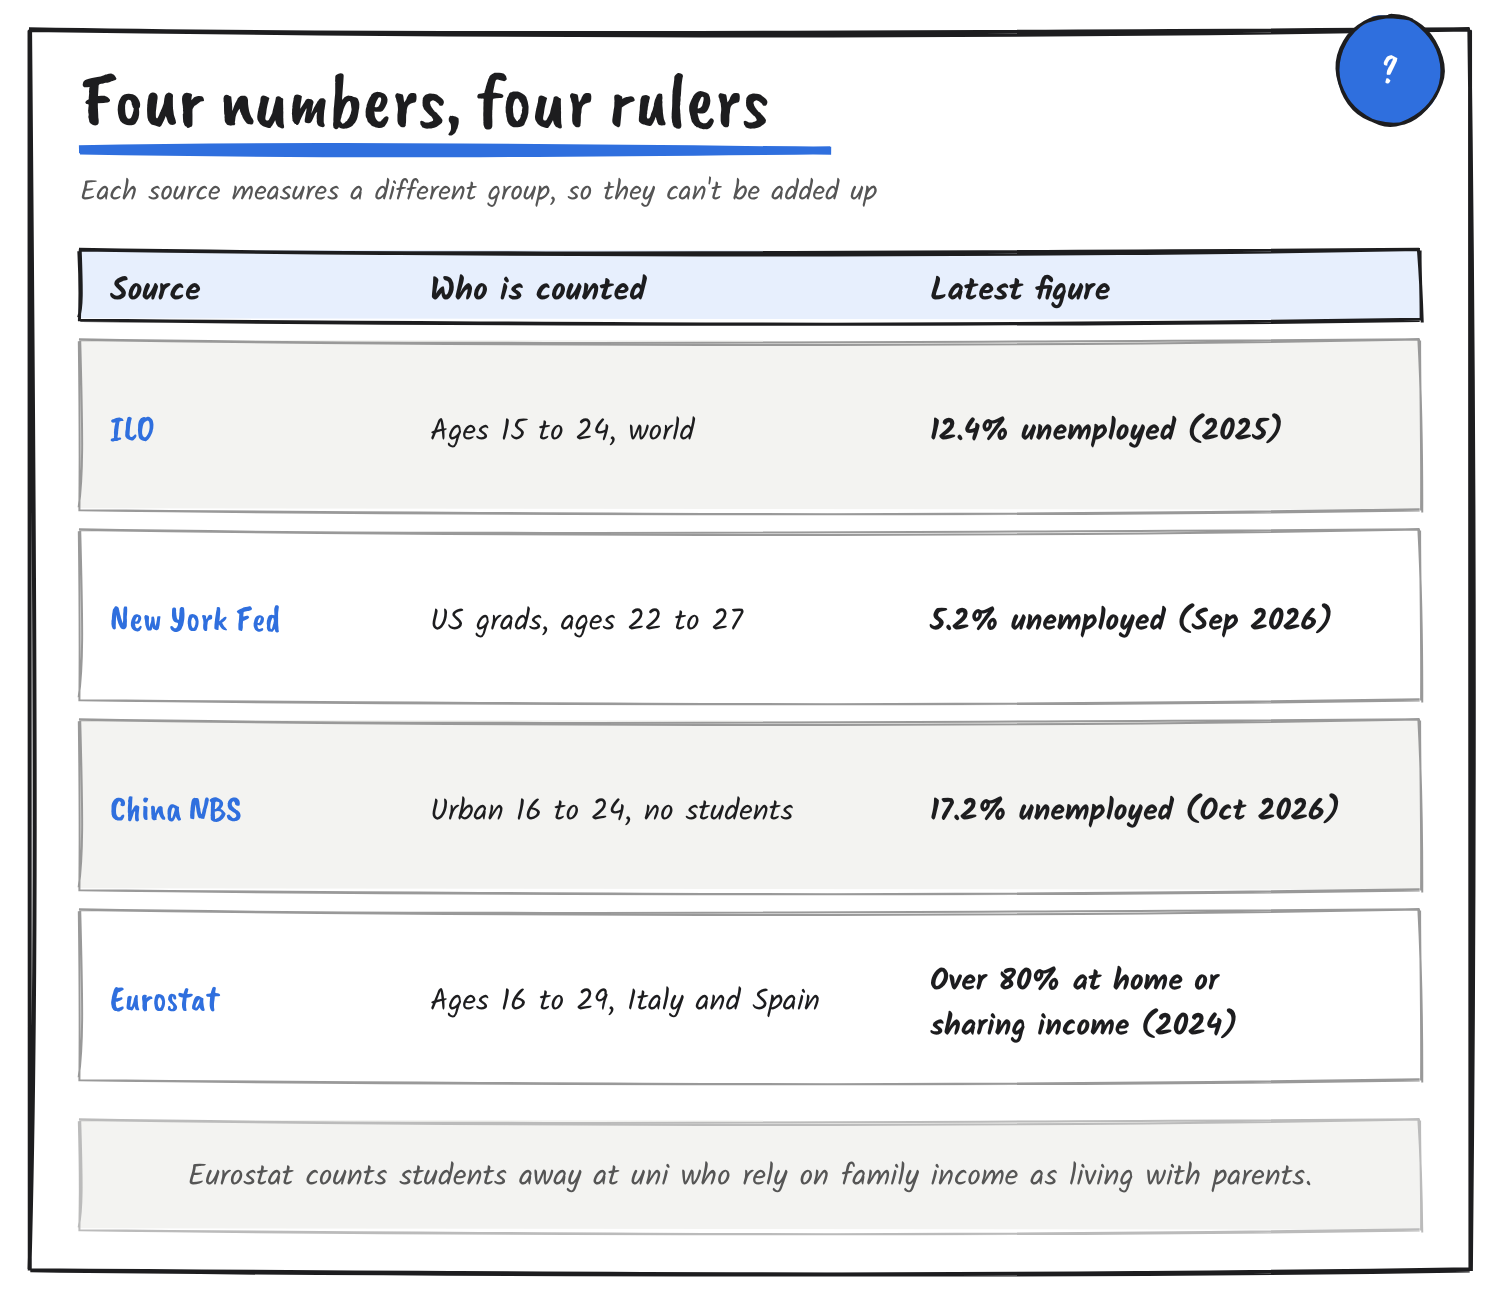
The claim that more than 80 per cent of young people in Italy and Spain live with their parents needs its definition attached. Eurostat’s 2024 housing figures say that in Croatia, Slovakia, Italy, Spain, Poland, Greece and Ireland, more than 80 per cent of 16 to 29-year-olds live with their parents or contribute to or benefit from the household income. That includes university students living away who rely on family money. For 25 to 29-year-olds in those countries, the share is more than 60 per cent.
It’s also not a recent shift. Eurostat says the situation at both ends of the range “tends to remain stable over time”, reflecting different practices on co-residence between generations. Italy’s NEET rate for 15 to 29-year-olds fell from 25.7 per cent in 2015 to 13.3 per cent in 2025, the biggest drop in the EU. Moving out also costs more in the countries where young people leave early: 26.9 per cent of young Danes spend over 40 per cent of disposable income on housing, the highest in the EU.
China: the seasonal lows keep creeping up
China’s National Bureau of Statistics publishes a monthly jobless rate for urban 16 to 24-year-olds, excluding students. It started the series again in January 2024 after suspending it when the previous measure, which included students, hit 21.3 per cent in June 2023.
The 2026 readings were 14.9 per cent in June, 17.9 in July, 18.9 in August, 18.0 in September and 17.2 in October, the last released on 18 November, according to Reuters, Caixin and the South China Morning Post. August matched the highest reading since the new method began. The Atlantic Council’s Nicole Goldin points to the June readings, which are the seasonal low each year: 13.2 per cent in 2024, 14.5 in 2025 and 14.9 in 2026.
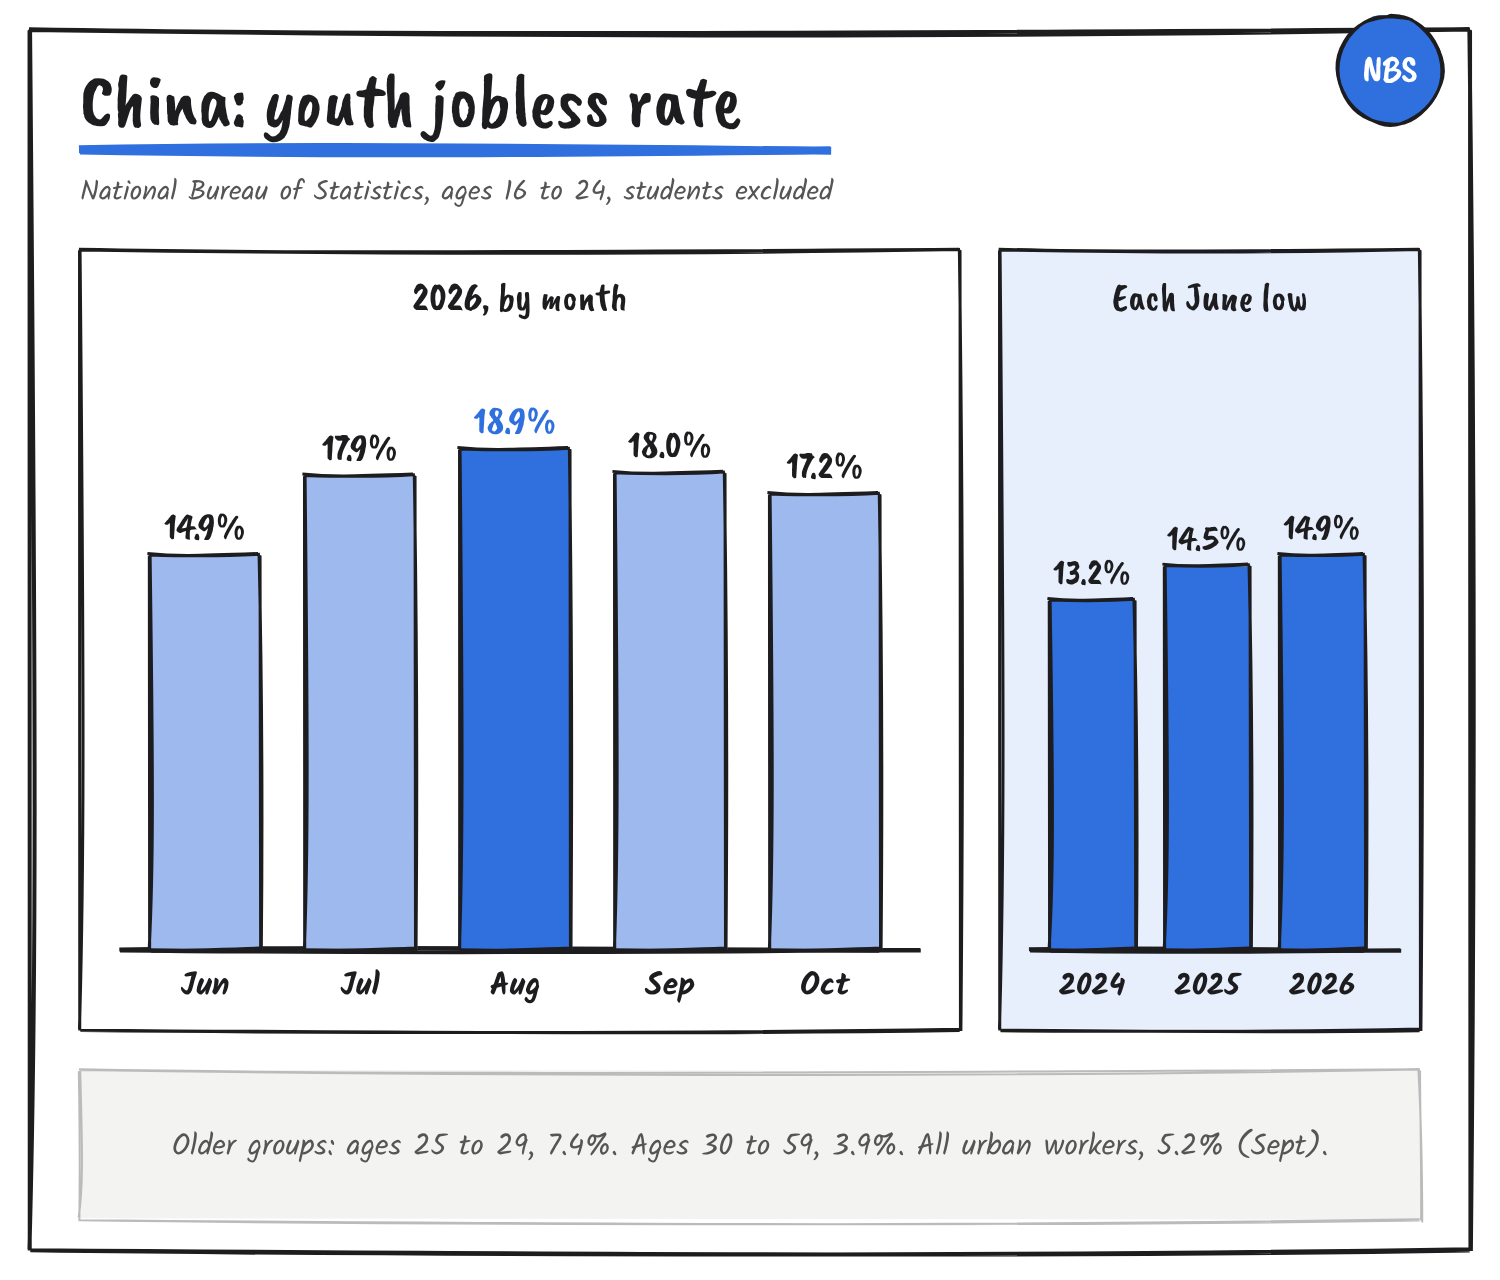
The gap with older workers is wide. In September the rate was 7.4 per cent for ages 25 to 29 and 3.9 per cent for ages 30 to 59, against 5.2 per cent for all urban workers. A record 12.7 million graduates entered the market this year, 480,000 more than in 2025, according to China’s Ministry of Education.
The World Bank’s December 2025 China update ties youth unemployment partly to fast-growing graduate numbers and slower job creation in high-skill services. Caixin quotes recruiter 51Job’s white paper saying hiring demand is about 40 per cent below its 2022 peak. Reuters reports a Citi estimate that 13.6 per cent of jobs held by Chinese workers in their 20s face high risk of AI-driven displacement.
On poverty, the claim that China’s poverty rate plunged holds on its own terms. China declared extreme poverty eliminated in 2021 by its national threshold, and the World Bank puts China’s poverty rate at 0 per cent at the US$3-a-day line in 2022. At the higher US$8.30-a-day benchmark the World Bank uses for upper-middle-income countries, 15.2 per cent of the population, 214 million people, still lived below the line in 2024. The bank’s October 2026 brief says real wage growth in urban non-private units averaged 4.1 per cent a year from 2022 to 2025, down from 7.9 per cent between 2011 and 2019.
Four rulers, so don’t stack the numbers
Each source counts a different group. The ILO covers ages 15 to 24 worldwide. The New York Fed covers US graduates aged 22 to 27. China’s bureau covers urban 16 to 24-year-olds who aren’t students, and Eurostat’s living-at-home measure covers ages 16 to 29 and counts anyone who shares household income. A 17.2 per cent jobless rate in China and a 5.2 per cent rate for US graduates aren’t comparable, and neither is comparable with the Eurostat share.
What the data shows, and what it doesn’t
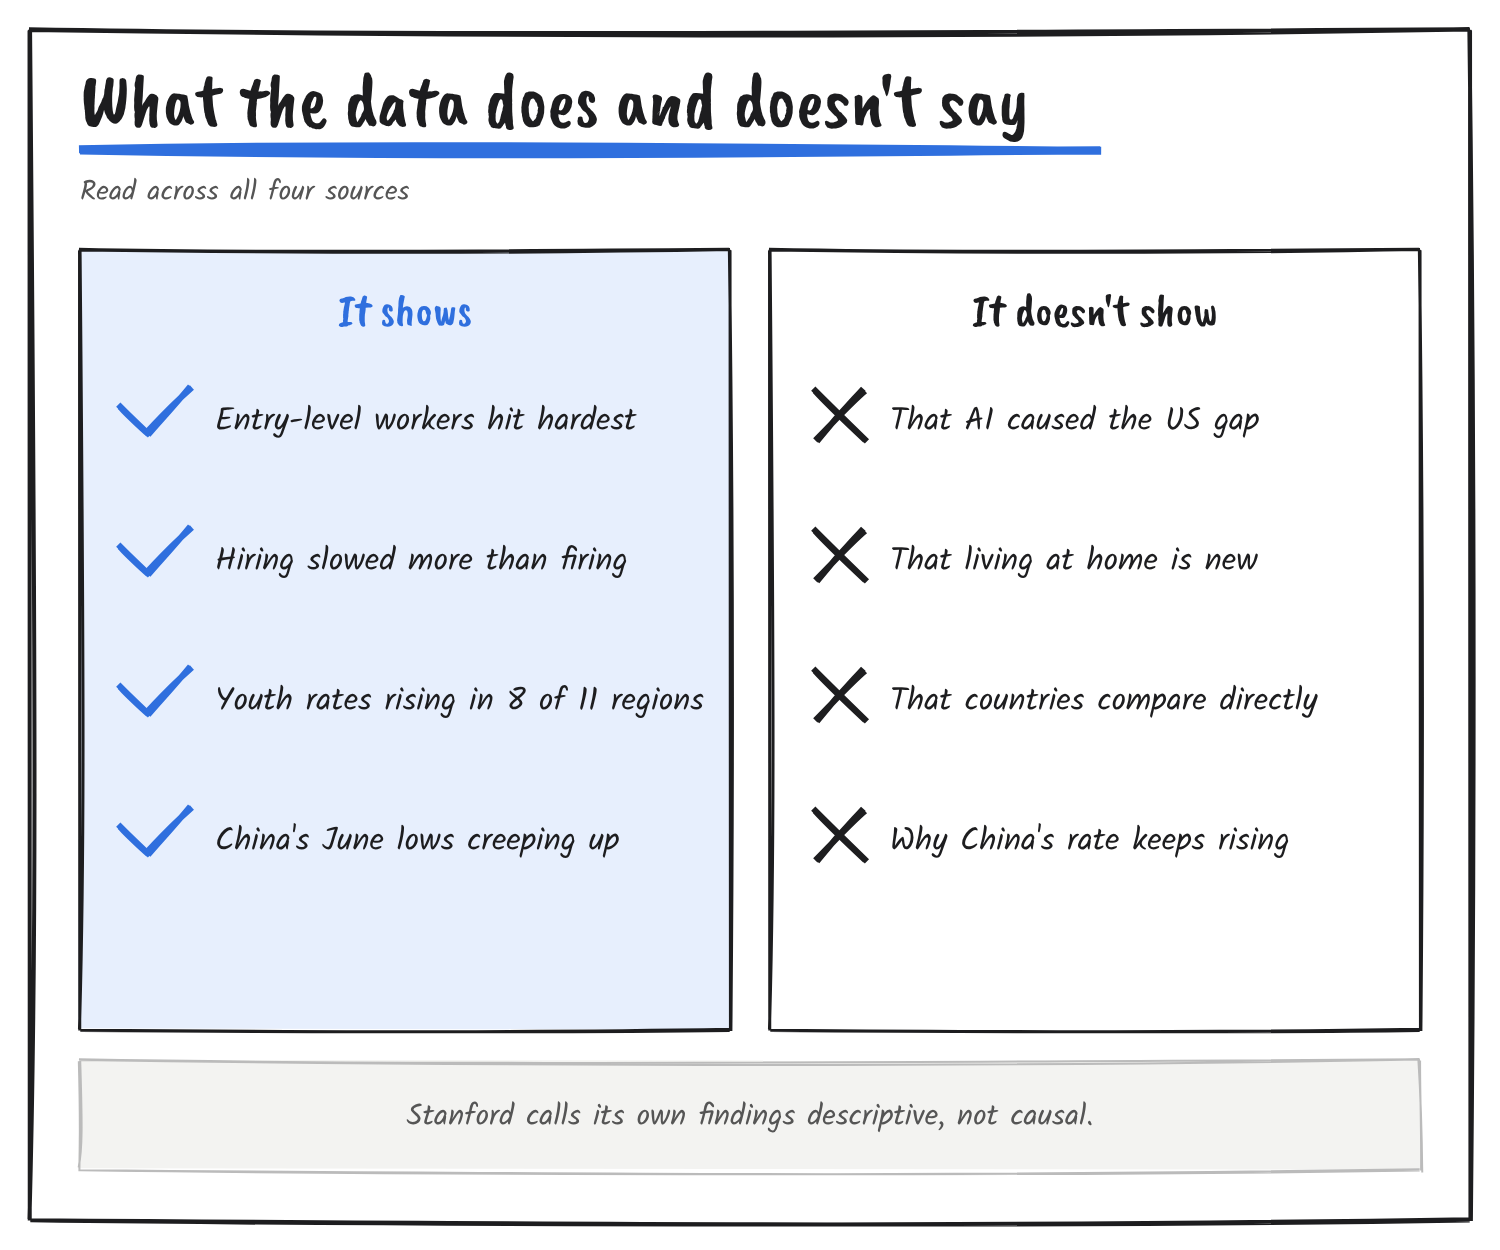
Across the sources, entry-level workers carry the weight. Stanford sees hiring slowing more than firing, the ILO sees youth rates rising in most regions, and China’s June lows keep climbing. The Stanford authors say they see no economy-wide displacement.
The data doesn’t show that AI caused the US gap. Stanford calls its own results descriptive, and the Richmond Fed dates the graduate reversal to 2018. It doesn’t show that living at home is a new trend in Italy and Spain, since Eurostat says the pattern is stable. It doesn’t explain why China’s rate keeps rising, where the World Bank, 51Job and Citi each point to different causes. And it doesn’t let you compare one country’s figure with another’s.
Three of these sources update on a schedule: Stanford’s dashboard monthly, China’s bureau monthly, and the New York Fed’s college labour market page quarterly.
Discover more from Sulat AI & Tech News
Subscribe to get the latest posts sent to your email.